HMI Editor
General information
Part of the Mervis IDE is also an integrated HMI editor. A HMI editor creates the human-machine interface. In the Mervis world, the HMI editor is used to create the textual or graphical interface definition between a PLC, or the control software, and a person - the user.
Installator contains also older Mervis HMI editor. This editor can be used to modify older definitions created in older releases of Mervis IDE.
The definitions are created in a HMI project. It is in the Solution Explorer at the same menu level as Executable projects or Library projects.

In a HMI project, different templates are created. In the Simple mode they are:
- Textual template for a PLC - LCD menu definition for a PLC with LCD display
- Textual template for a Terminal - LCD menu definition or a Mervis Visual menu definition
- Graphical template for a Terminal - Graphical template for HT200 or a Mervis Visual menu definition
- Textual template for a Function Block or Program - a specific definition for a function block or program.
The HMI Editor Workspace
To give you a better idea of how the HMI Editor operates within the IDE, here is an example of a comprehensive SCADA template being designed:
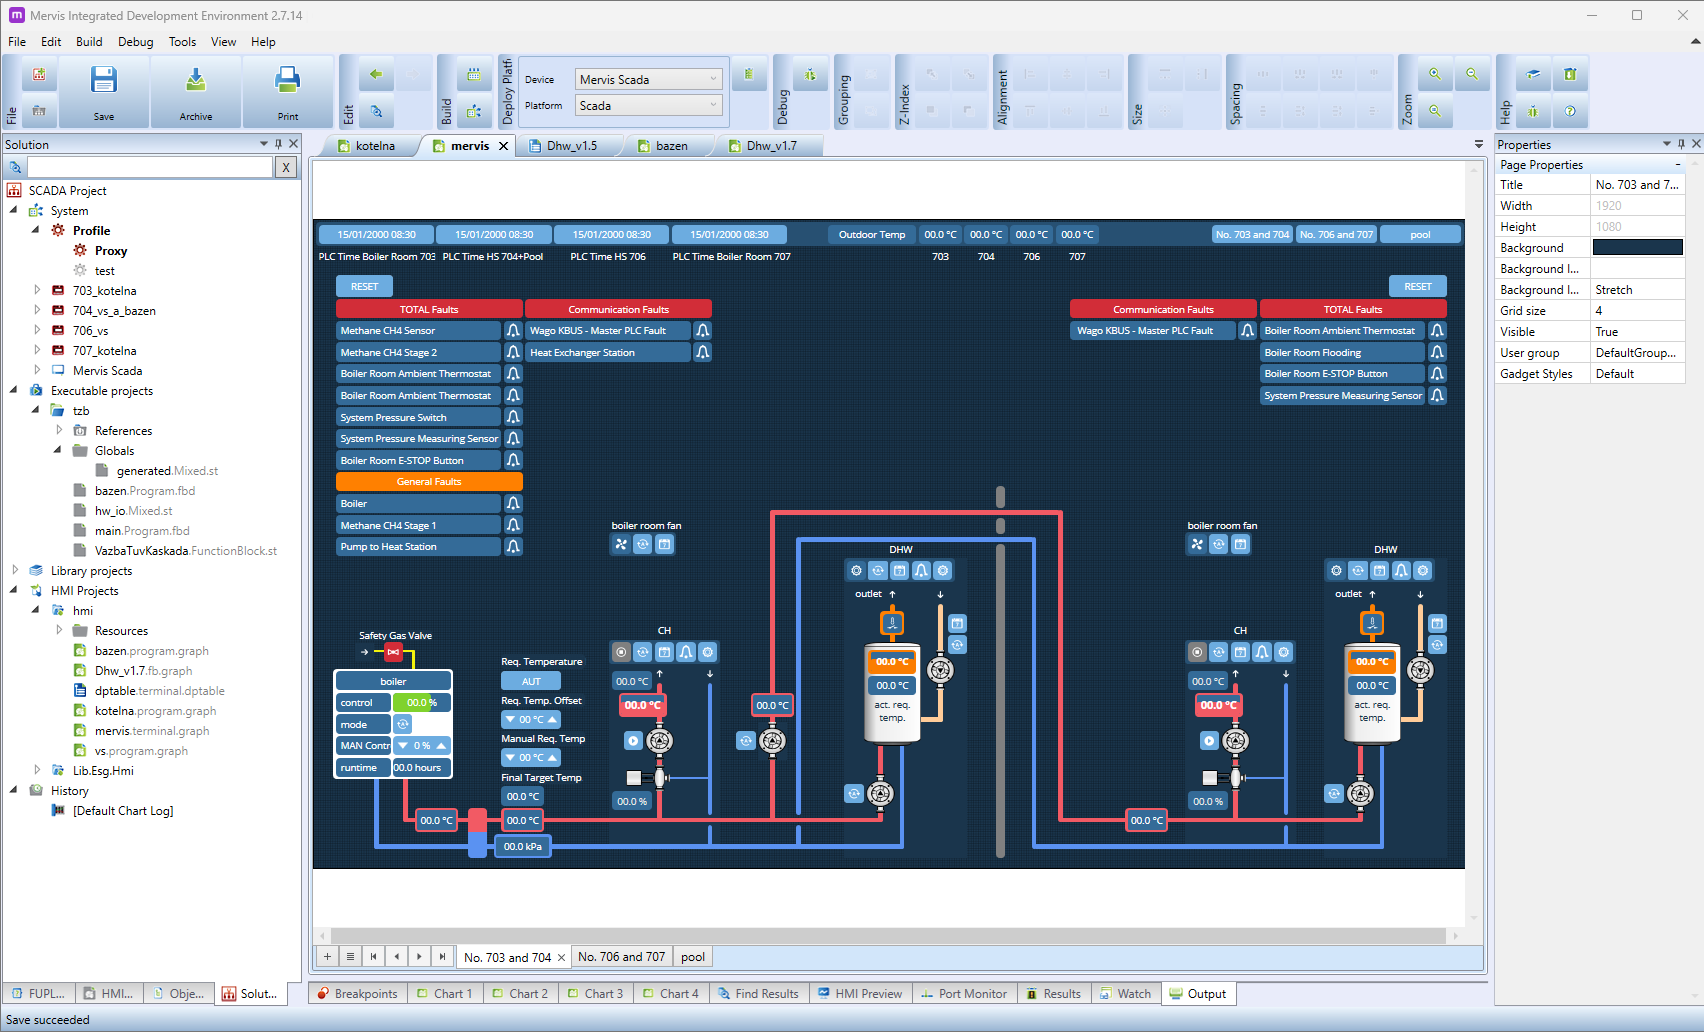
When working in the HMI Editor, the IDE layout is optimized for visual design and hardware configuration:
- Solution Explorer (Left Panel): Your HMI projects are organized here alongside your executable logic. You can manage your graphical templates (such as the `.graph` file shown above), history logs, and imported visual resources.
- Design Canvas (Center): This is the main graphical interface where you build your visualizations. As seen in the example, you can create intricate layouts including pipes, pumps, dynamic temperature readings, interactive control buttons, and alarm states.
- Properties Window (Right Panel): This context-sensitive window dynamically updates based on what you have selected on the canvas. For instance, when clicking on the page background, you can configure the page Resolution (e.g., setting it to FHD 16:9 for a 1920×1080 display), document file names, and other global visual settings.
- Bottom Panels: Access crucial debugging and build tools, including the HMI Preview tab to test the look and feel of your graphical interfaces before deploying them to the controller or web panel.
Using Custom Graphics and Mervis Symbols
You can enhance your graphical templates by importing custom icons, such as those from the freely available Mervis Symbols library. There are two primary ways to implement these within the HMI Editor:
Static Images
For symbols that serve as background elements or do not change based on controller data, utilize the standard Image object.
- The Image object displays a graphic taken directly from a local file.
- To configure it, place the Image object onto your canvas, and then select your downloaded image's path and filename within the Properties window.
Dynamic State Mapping
For symbols that need to update dynamically based on live controller data (such as a pump turning on or a valve opening), utilize the States mapping feature.
- Select your graphical object and navigate to its properties to map the states corresponding to your variable's values (e.g., 0 for OFF, 1 for ON).
- Within the state configuration, you can attach a specific, optional image for each state.
- This allows the HMI to automatically swap Mervis Symbols based on the live data reading, alongside updating status text and other visual properties.