Mouse Control
- Mouse control in Mervis IDE is mostly the same as in the other applications:
- Right click displays context menu.
- Left click to select/deselect object.
- Left click and drag for multiselection.
- Left click and drag previously selected object to move the object.
- Left click and drag of the edge of FBD working space to resize the working space.
- Press Ctrk key and scroll to zoom the FBD workingspace in/out.
- Mouse wheel click to use the “hand tool” to move around the FBD workspace.
- Mouse wheel scroll to scroll.
Line editing
- Left click and drag from the port (variable, i/o of function/function block) to another port to draw the line.
- Left click on the line to select the line.
- Right click on the line and “Create point” to create new segment on the line.
- Right click and “Delete segment” to delete segment on the line.
- Left double-click to erase all segments on the line and to create the easiest line possible.
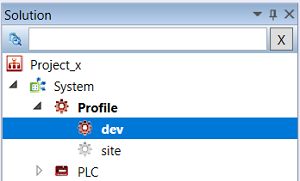
Solution browser
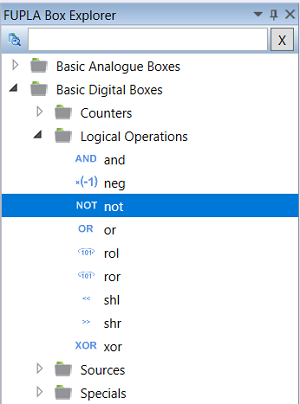
FUPLA block explorer
Select a function block with the left mouse click, and drag it to insert the block to the schema.
Double click the block to insert it into an open program.
Trends
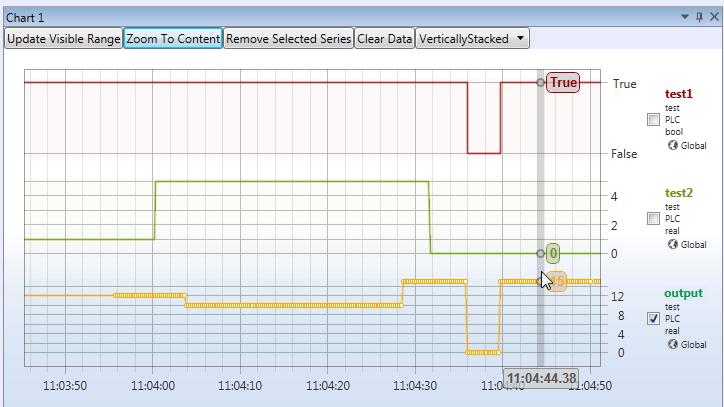
After a variable is inserted in the trend, the trend is displayed, and current variable values are added. The time axis moves and the time range increases in the “Update Visible Range” mode.
- Click the graph to select a time interval, the “Update Visible Range” is switched off.
- Click the left mouse button in the graph and drag to zoom to a specific interval.
- Click the right mouse button in the graph and drag to move the time span in the zoomed state only.
- Click the left mouse button to a plot line to select the variable, hold CTRL to select more variable plots at a time.
- Double click the left mouse button to zoom out, or “Zoom To Content.”


