System status
The system status will be displayed at the debugging which can be started after the project has been uploaded to the PLC. Click the “Start debugging” button in the ribbon.
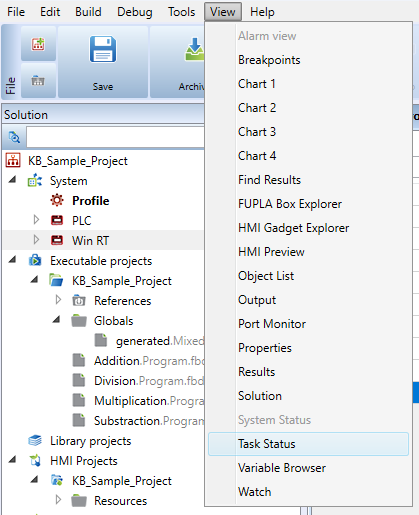
There is a prompt which PLC has to be debugged (or, connected to). This is to select a PLC in a network (Solution) where more PLCs are defined. The system status is displayed in the “Task status” tab which will be opened automatically or in the View - Task status menu.
The “Start debugging” button starts debugging immediately if there is only a single PLC in the Solution. If there are more PLCs, a prompt opens, and more PLCs or just a selected PLC can be debugged at the same time.
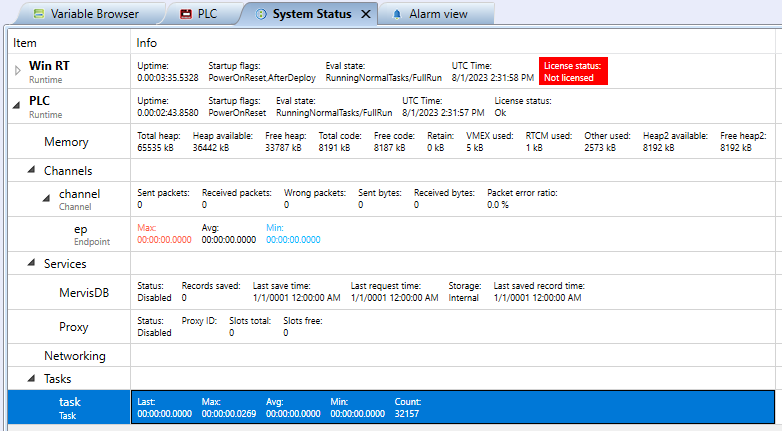
System status information displayed - PLC
- Uptime - How long the program has been running since restart
- Task number - How many tasks there is in the PLC.
- Evaluation status - Current status or mode of the PLC activity.
- Running tasks mask - Correctly running tasks.
- Failed tasks mask - Failed tasks.
- UTC time - Time which is set in the PLC, as Universal Time Coordinated (London time).
Memory
Status of total and used memory in the PLC. VMEX memory: internal memory for the virtual machine. RTCM memory - memory used for communication purposes (all channels, buffers, communication variables).
Channels
Displays sent, received and faulty packets, and error statistics for every channel. ep (endpoint) indicates how long a communication takes for a particular channel.
Services
Mervis DB shows the status of communication with the Mervis database (in case the Mervis DB connection is configured).
Proxy shows communication status of the Proxy server.


