Break points
It is possible to go step-by-step when debugging, and watch the changes of variables in the program.
ST
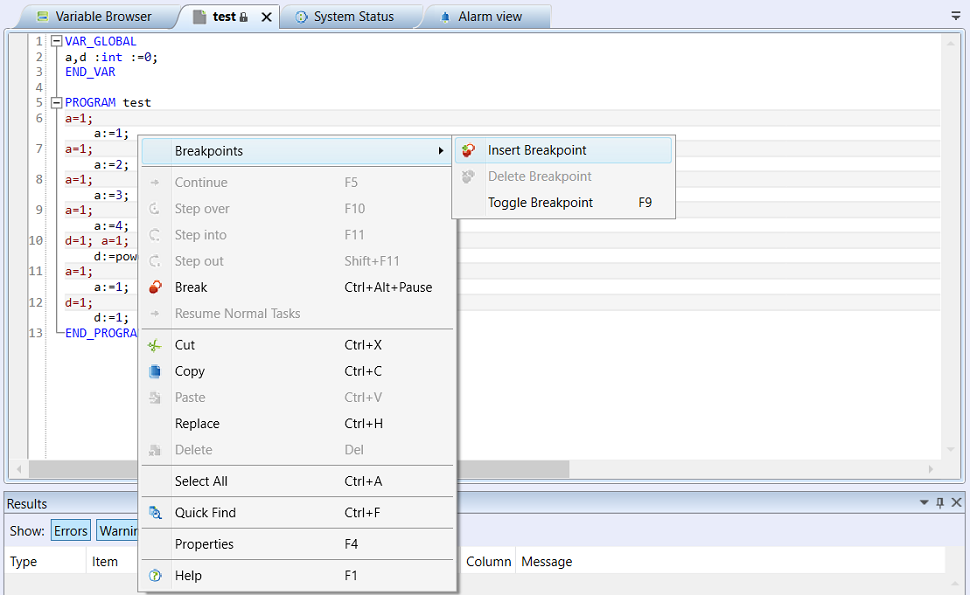
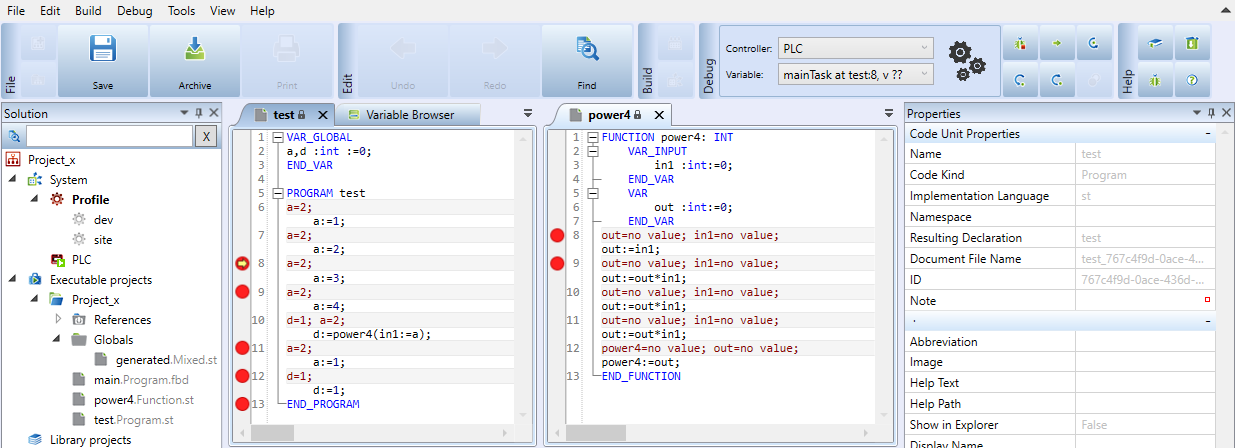
A breakpoint may be inserted in two ways: a mouse click left from the line number in the program, or right click and “Breakpoints - Insert breakpoint” in the context menu.
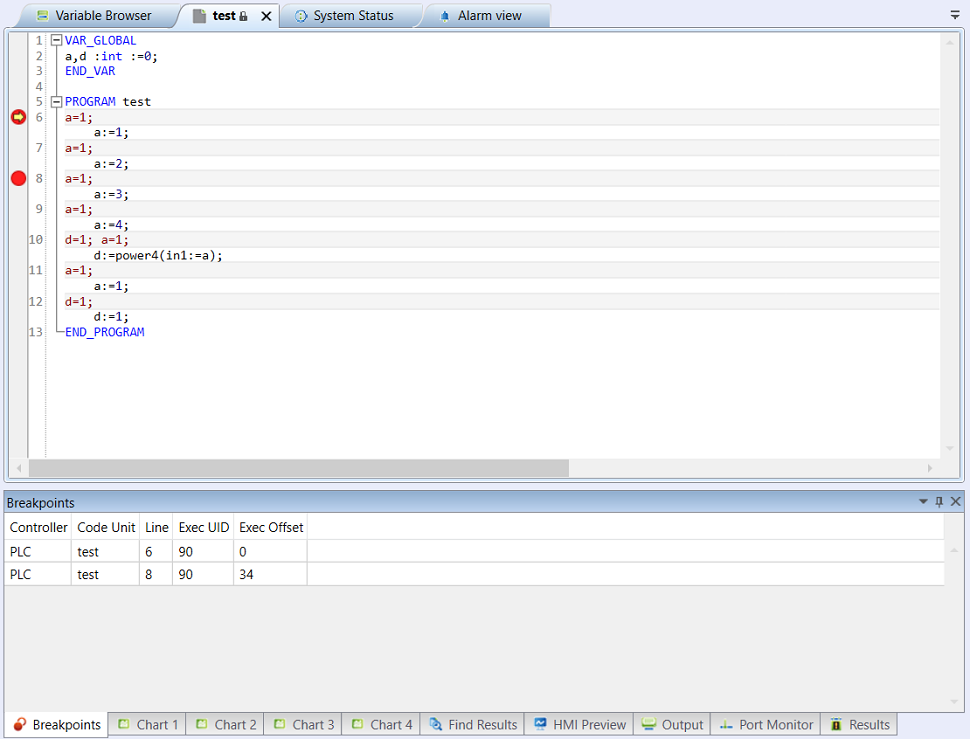
Inserted breakpoints are recorded in the “Breakpoints” tab.
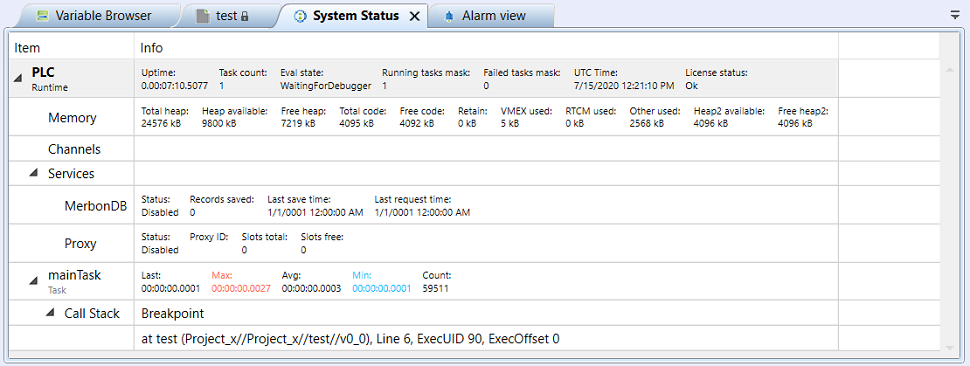
If a program is stopped at a particular breakpoint, in the “System status” tab the breakpoint is visible.
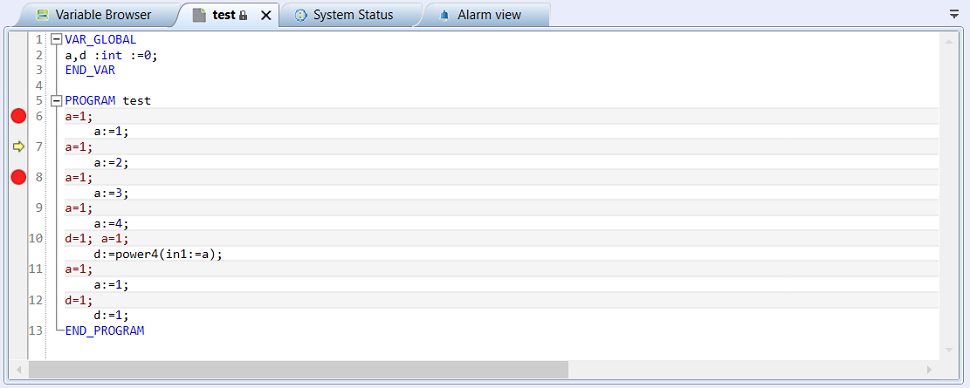
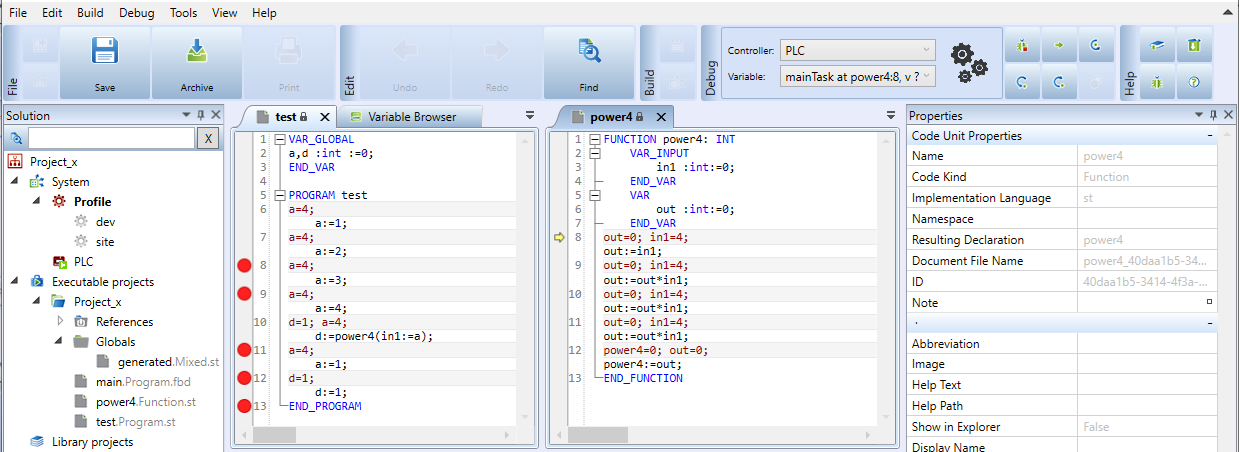
In the program, the current position of the stopped program is marked by a yellow arrow.
Breakpoint in FUPLA
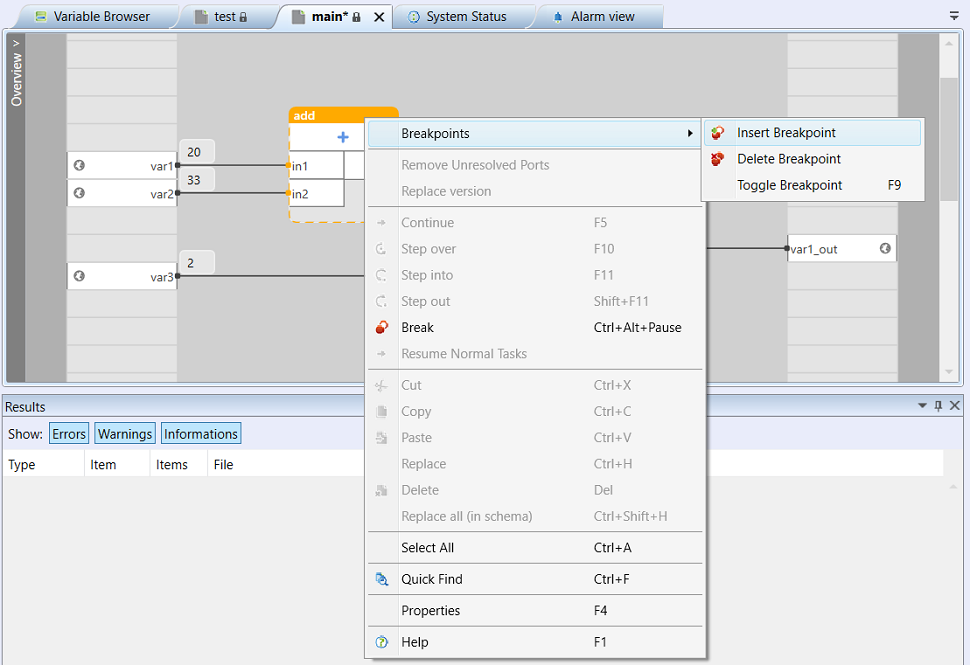
In FUPLA, the breakpoint is similar to the ST editor. Right click and select “Breakpoints - Insert breakpoint” in the context menu or select a block and use the F9 key to toggle breakpoint.
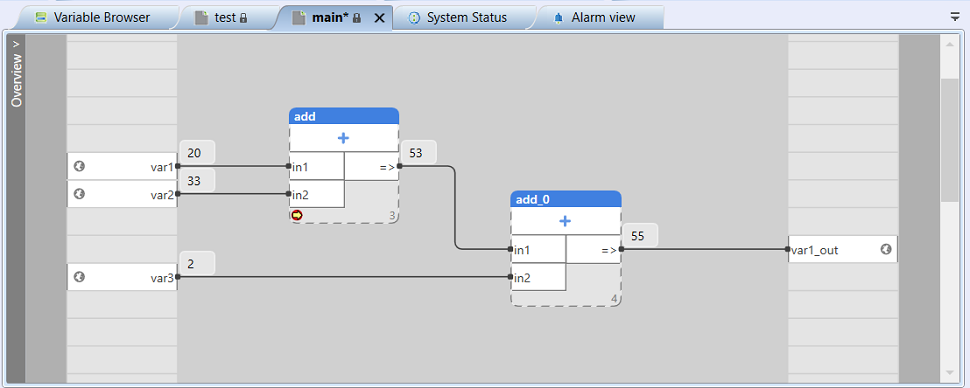
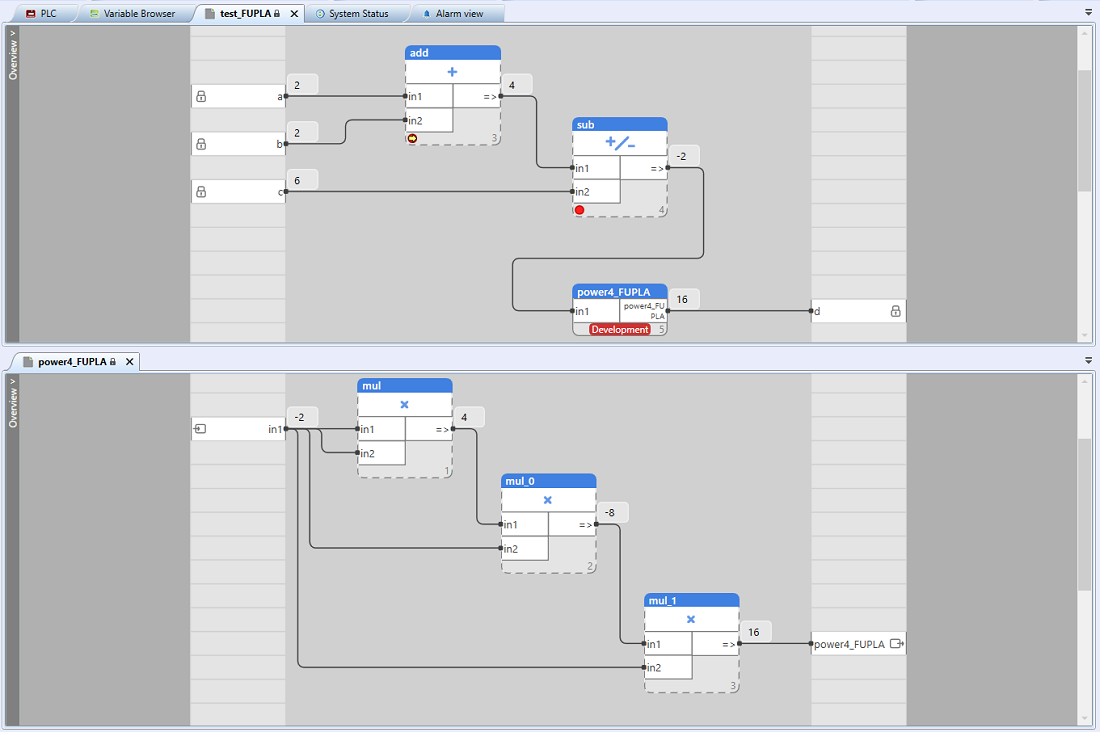
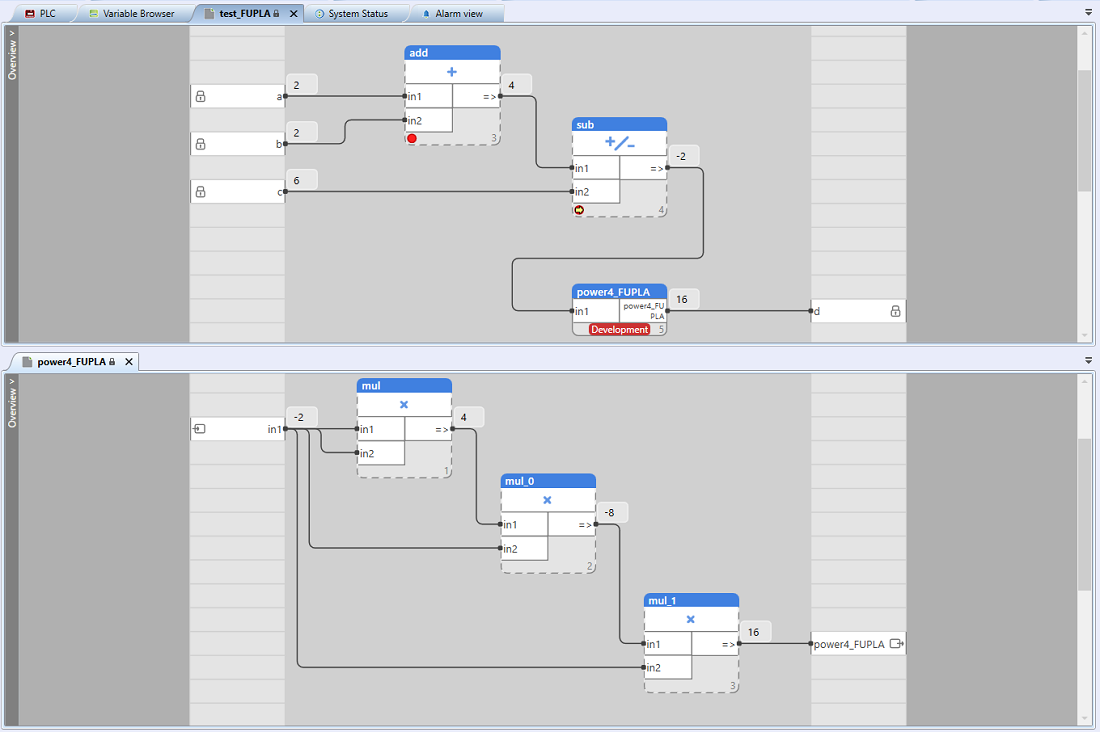
The indication is similar to that in the ST. In the program, the current position of the stopped program is marked by a yellow arrow. In the lower right corner of the block there is a number which specifies the order of the steps.
Breakpoint step by step
 Continue [F5] - Program continues to another breakpoint.
 Step over [F10] - Program goes to the next command (not necessarilly to a breakpoint).
 Step into [F11] - Program goes to the next command or enters a function / method from current command (marked by an arrow, if it is a single command in the line).
 Step out [Shift+F11] - Program jumps out from a function / method to the point from which the function / method was called.
 Break [Ctrl+Alt+Pause] - Program stops at the current position, from this position the program can be debugged step by step.
Example of stepwise program execution in ST
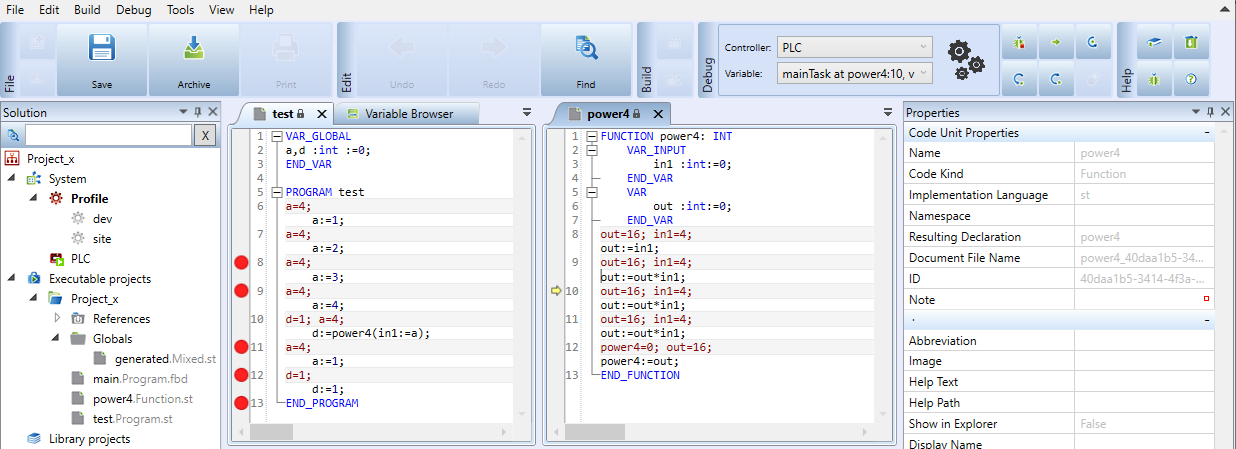
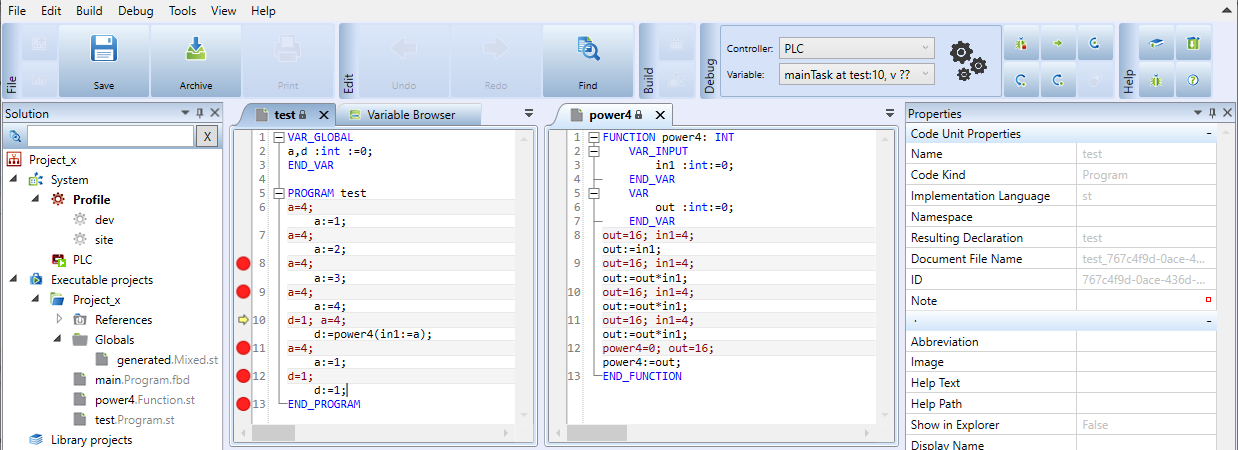
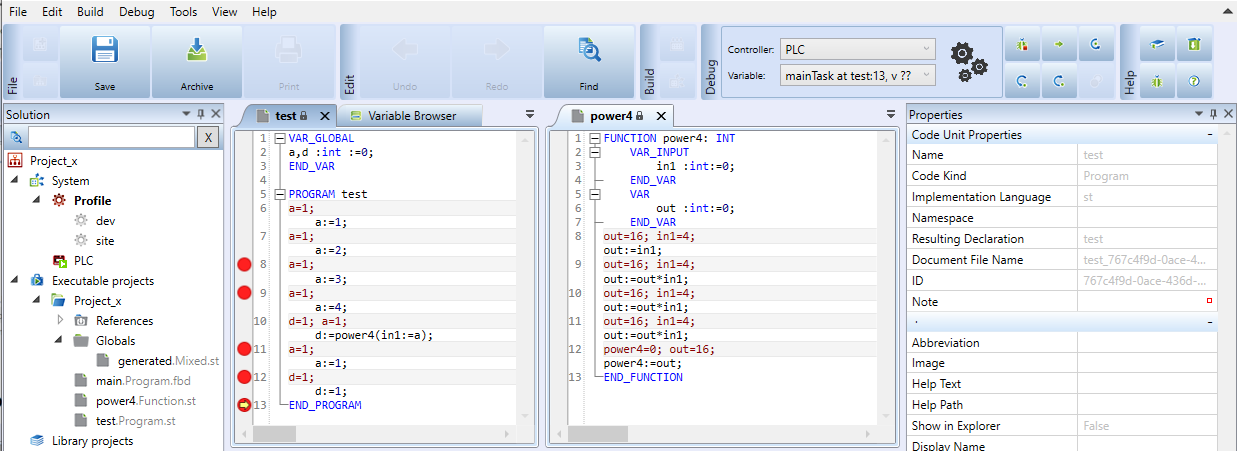
An example how to go step-by-step and follow the changes of variables and execution of a function which calculates fourth power of a number. When the debug is started, the program interrupts the execution at the first breakpoint.
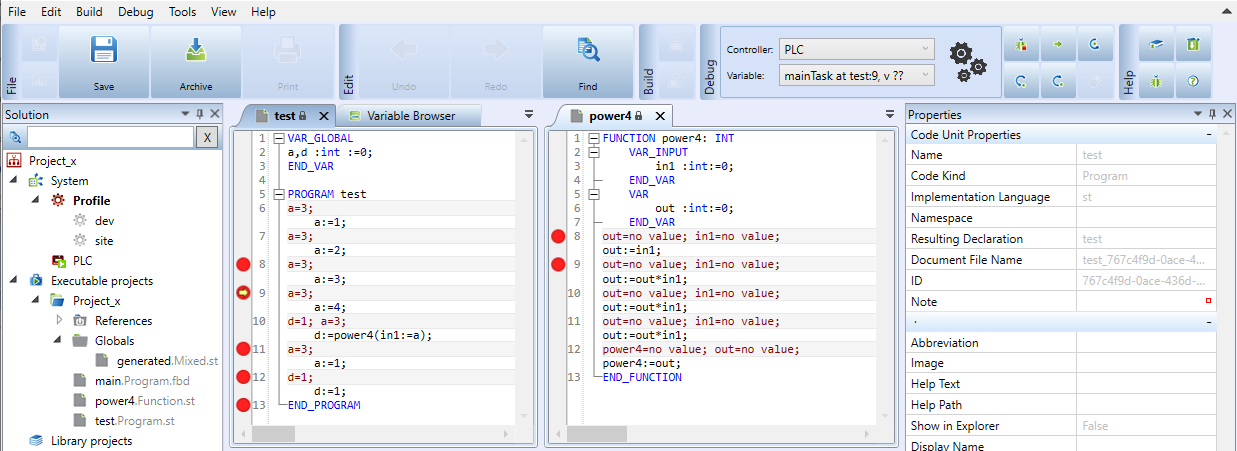
Press Continue [F5] to jump to the next breakpoint at line 9.
If no breakpoint is inserted but we want to follow the program state even if the function is running, we have to use the Step into button [F11].
In the called function, go further using Step over [F10] and Step into [F11] buttons.
The called function is exited only after all lines of the function code are executed, or by pressing the Step out [Shift+F11] button, which jumps to the point where the function was called, or Continue [F5], which jumps the program to a next breakpoint.
By going step by step, the program goes from the last breakpoint again to the first breakpoint.
Example of step-by-step debugging in FUPLA
Example to show how to go step-by-step in a function for adding, subtracting and multiplication. When the step-by-step debugging is started, the program stops at the first breakpoint.
The next breakpoint is reached by the Continue [F5] button.
Using Step over [F10] and Step into [F11], we may go as deep as to the internal code of the function. The code is left by the Step out [Shift+F11] button.
