Alarms
 Alarm Icon
 Alarm Overview
1. Tree Overview
The display has two levels: Project name - data point located in the alarm.
Next to the project name is a digit indicating the total number of alarms within the project.
In the case of multiple projects, you can use the Filter or filter by significant properties.
 Field for entering the filter
2. Current Alarms
The overview shows all current data points in alarm.
For each data point, there is information about the alarm status:
 | Active Alarm |
Clicking invokes a dialog box with information about the alarm value, the time the alarm occurred, and the current time. In the window, you can confirm the alarm, display it in the project, or just close the dialog box.

Dialog Box – Active Alarm
 | Acknowledged Alarm |
The dialog box no longer allows confirming the alarm. Additionally, it contains information about the time the alarm was confirmed.

Dialog Box – Acknowledged Alarm
3. Filtering Data Points in the Alarm Overview
| | Show active alarms |
| | Show acknowledged alarms |
 | Show alarms from all projects |
 | Alarm history range |
 | Reload data |
 | Show/hide history panel |
 | Acknowledge all selected |
 | Reset all selected |
 | Download history in CSV format |
 | Show information about highlighted/selected data point |
 | Priority update of the highlighted/selected data point |
4. Alarm History
History shows the time of alarm creation/cancellation, who (which user) acknowledged the alarm, and the current status of the alarm.
The history can be sorted by the time of alarm creation/cancellation.
Three Filters can be used for searching: path / data point / user
Alarm Settings
To configure or reset alarm parameters for individual data points, you can access the Alarm Settings menu directly from the data point's action menu.

Alarm Settings Menu
- Locate the target data point in your tabular view.
- Click the Checkmark Icon (☑️) to open the context menu.
- Navigate to the Alarm Settings section at the bottom of the list.
- Select one of the following options:
- Set alarm settings: Allows you to define or modify the alarm conditions and parameters.
- Restore alarm settings: Reverts the alarm configuration to its default state.
Selecting Set alarm settings opens the detailed configuration window:
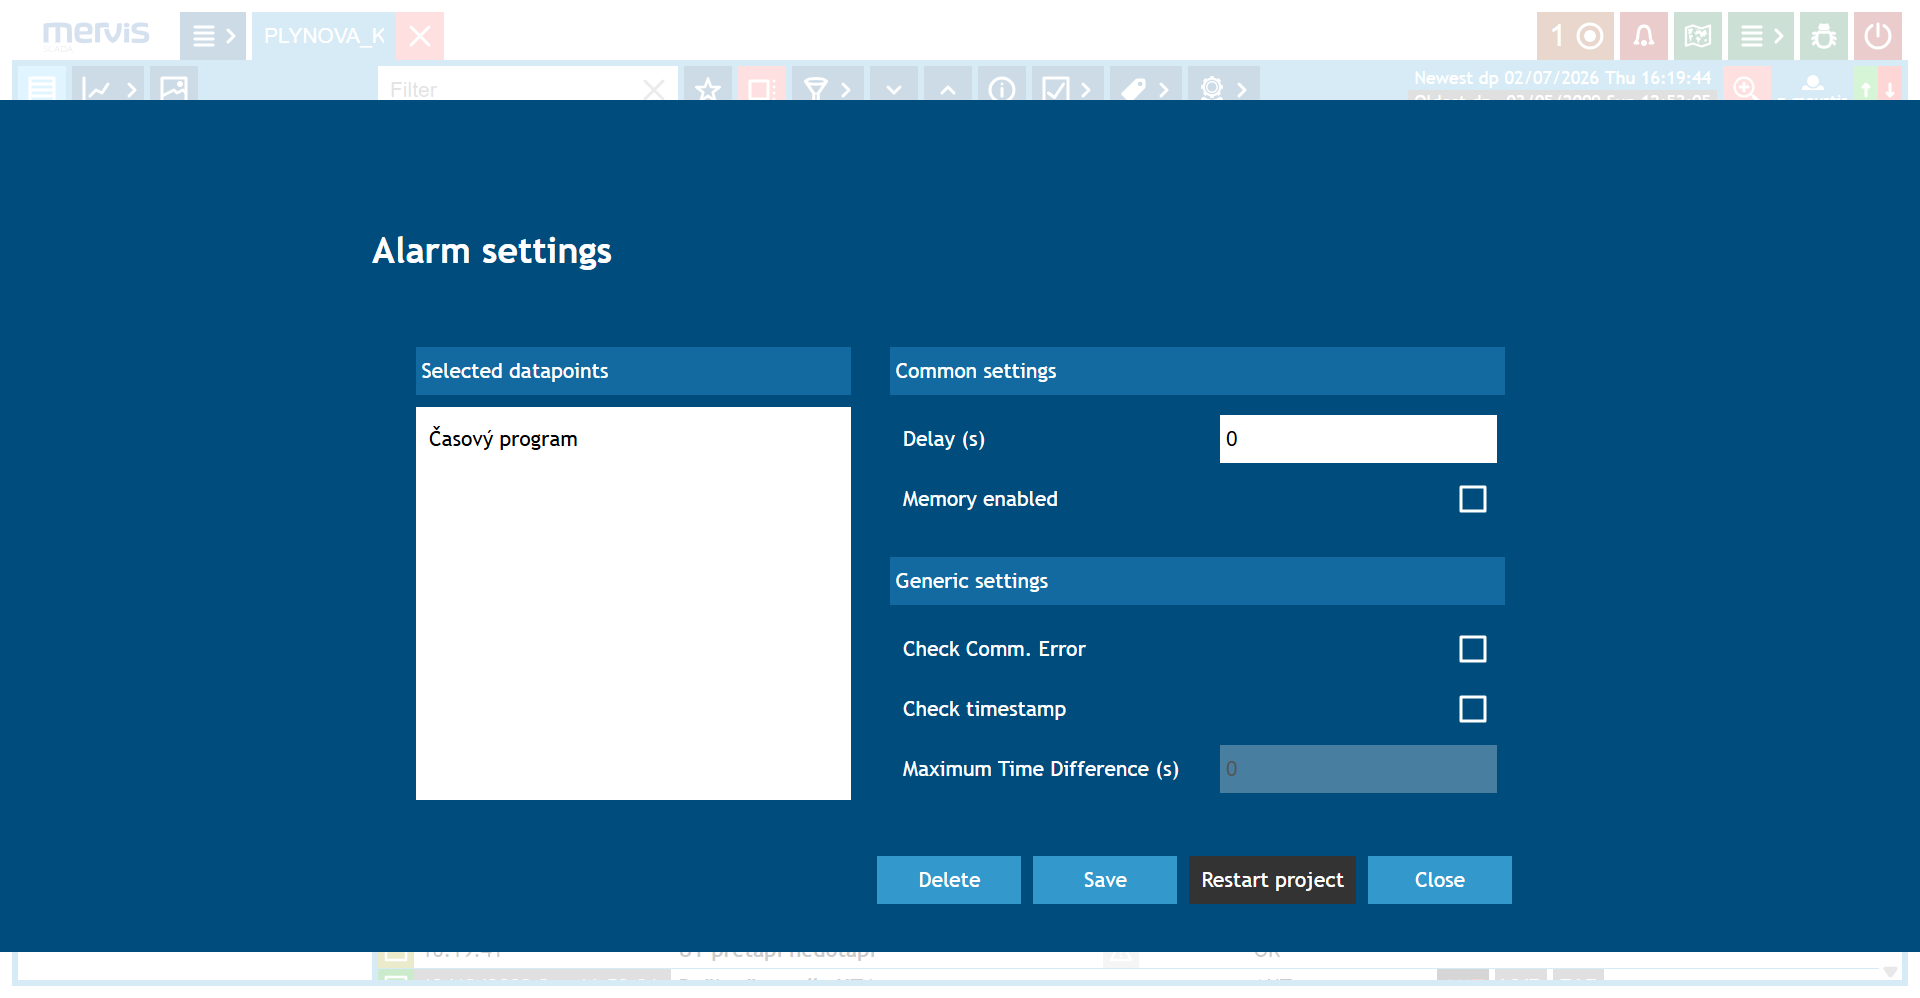
Alarm settings detail window
Configuration Options
The detail window is divided into several core sections:
- Selected datapoints: Displays the specific data points you are currently configuring (e.g., Časový program).
- Common settings:
- Delay (s): Specifies the time delay in seconds before the alarm is triggered after the condition is met.
- Memory enabled: When checked, the system remembers the alarm state, keeping it active even if the triggering condition temporarily resolves.
- Generic settings:
- Check Comm. Error: Triggers an alarm if there is a communication error with the underlying device.
- Check timestamp: Validates the timestamp of the incoming data against the system clock.
- Maximum Time Difference (s): Sets the allowed threshold (in seconds) for timestamp validation if “Check timestamp” is enabled.
Once configured, apply your changes using the action buttons at the bottom: Delete (removes the setting), Save (applies the configuration locally), Restart project (deploys changes to the active project), or Close (cancels the operation).
Alarm and Its States
Each point that has active alarm behavior can, depending on the settings, take on different alarm states and gradually transition between these states, as shown in the following image.
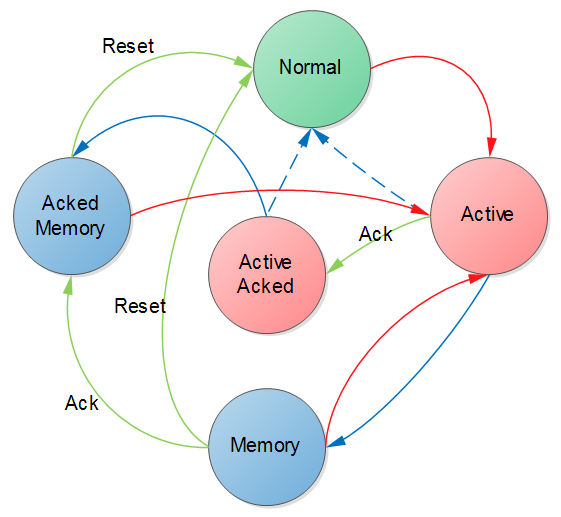
Overview of alarm states and transitions
- Texts in circles correspond to the alarm state.
- Arrows between them represent the following transitions between states:
- Red arrow - alarm creation
- Blue solid arrow - alarm cancellation
- Blue dashed arrow - alarm cancellation with enabled automatic reset
- Ack - acknowledgment request
- Reset - reset request
- If an action is triggered that is not plotted in the diagram, it is ignored (e.g., reset request in the Normal state)