Table View
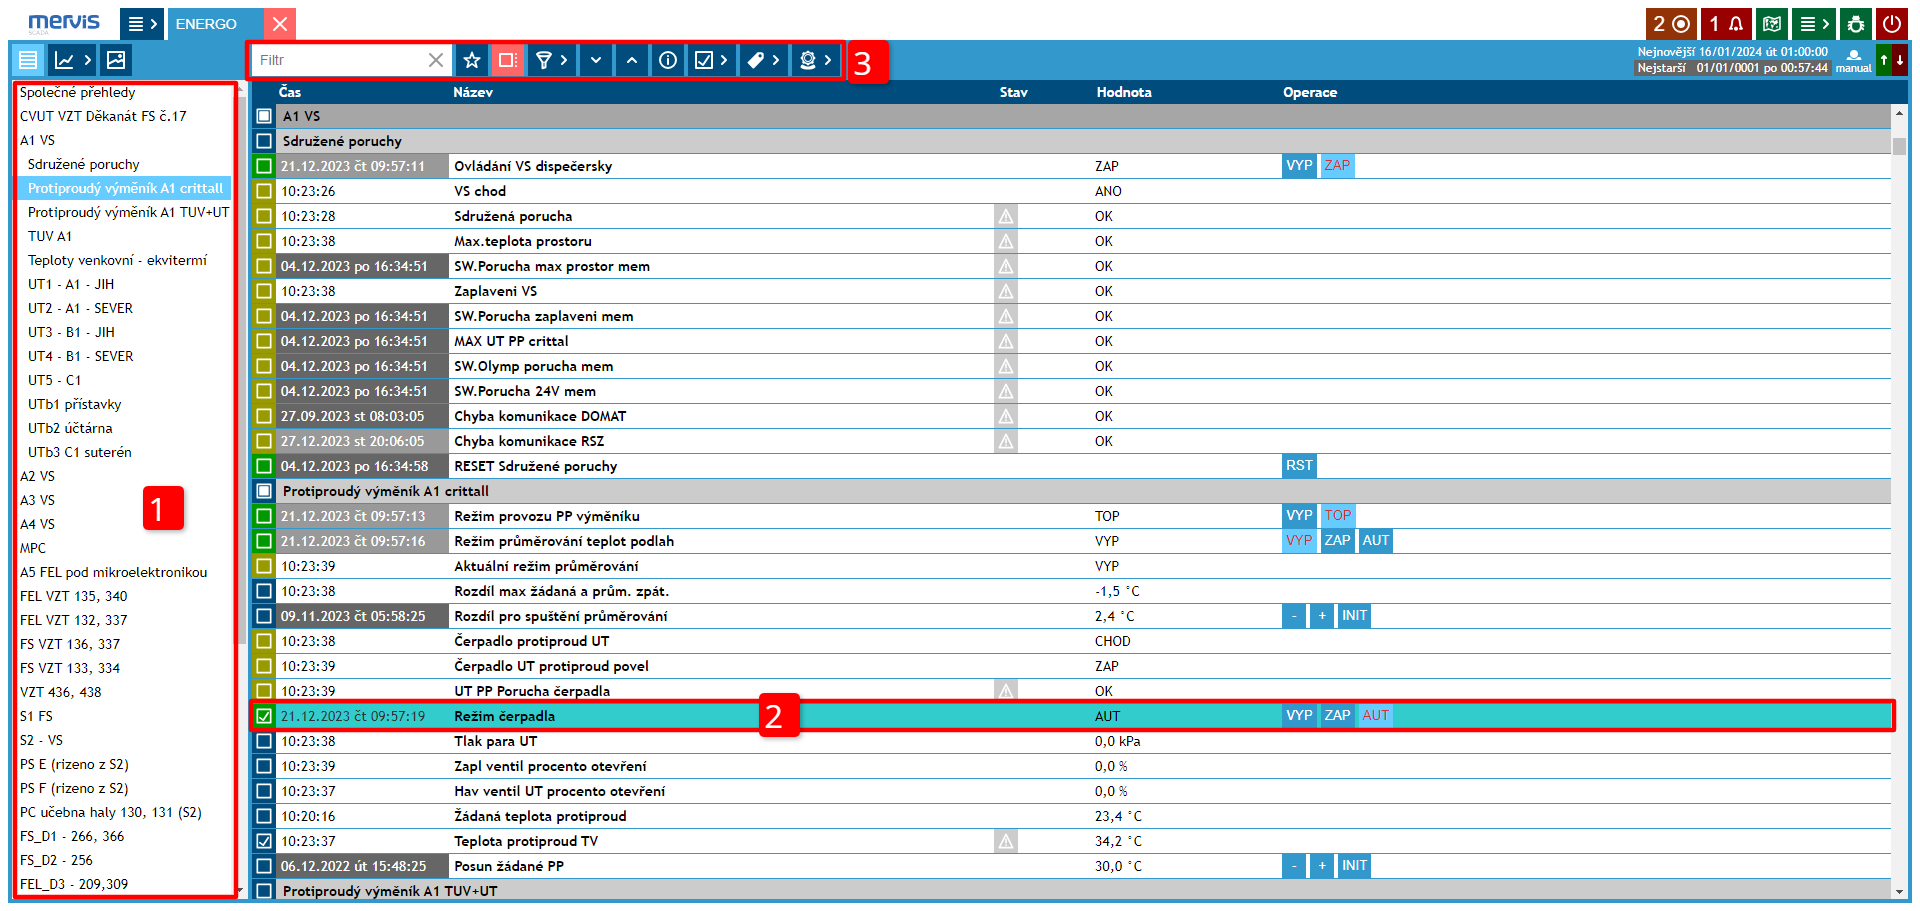
The table view is a basic visualization of data points. It displays all available information in the project. It allows for control, parameter settings, etc.
1 Tree View
The overview is divided into levels. The tree view allows for quick and clear searching for the required information displayed in the data points.
2 Data Point
Each data point can be selected by clicking on the square to the left of the timestamp and then displayed in the graph.
It is possible to navigate between selected data points or completely deselect them.
3 Filtering Data Points
Data points can be filtered by name, which is written into the Filter, or by distinctive properties.

 | Favorite data points |
 | List of data point filtering options |
 | Information about the selected data point |
 | Bulk operations |
 | Tag editing |
 | Administration |
Non-communication is indicated by

4 Currently Selected Data Points
If at least one data point is selected, information about the active selection and the number of selected data points is displayed.
Any number of data points can be selected from any project available to the user.
By clicking on the symbol, the user is shown a list of all selected data points.


