This is an old revision of the document!
Dashboard Overview
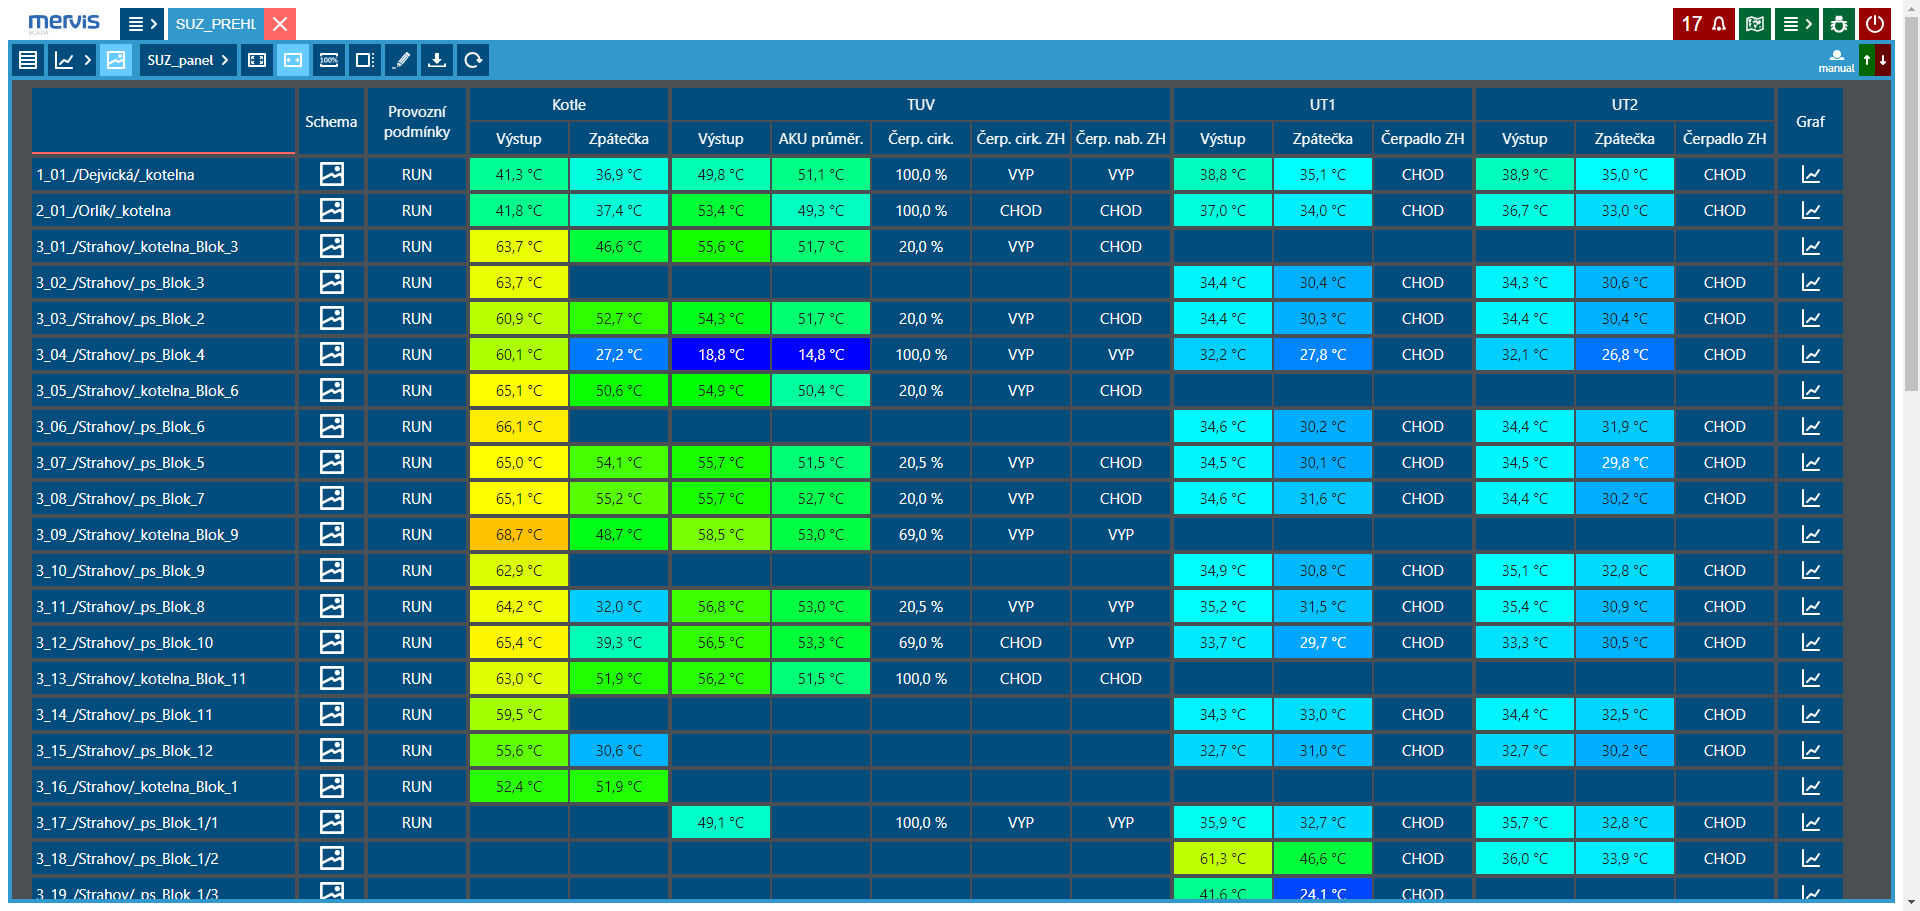
Data points can be displayed in the form of a dynamic row overview.
Value displays can be colored according to a specified color scale.
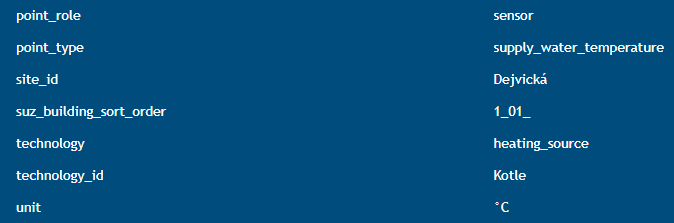
Tags are used for the creation of the dashboard overview, which need to be assigned to the desired variables.