Table of Contents
Web server
The integrated web server on a PLC allows to create user access policy and analyse trend data, control multiple PLCs from a single web server (Controller as external webserver) and display a text template (Change from graphical page to text page).
Note: if the PLC works as an integrated web server (displaying values from “this” PLC only), it is not possible to use it as External webserver (i.e. as a web server for data from more PLCs in a network) at the same time, and vice versa. The web pages are overwritten by the most recent content at every web pages upload.
New graphic template for web in a PLC
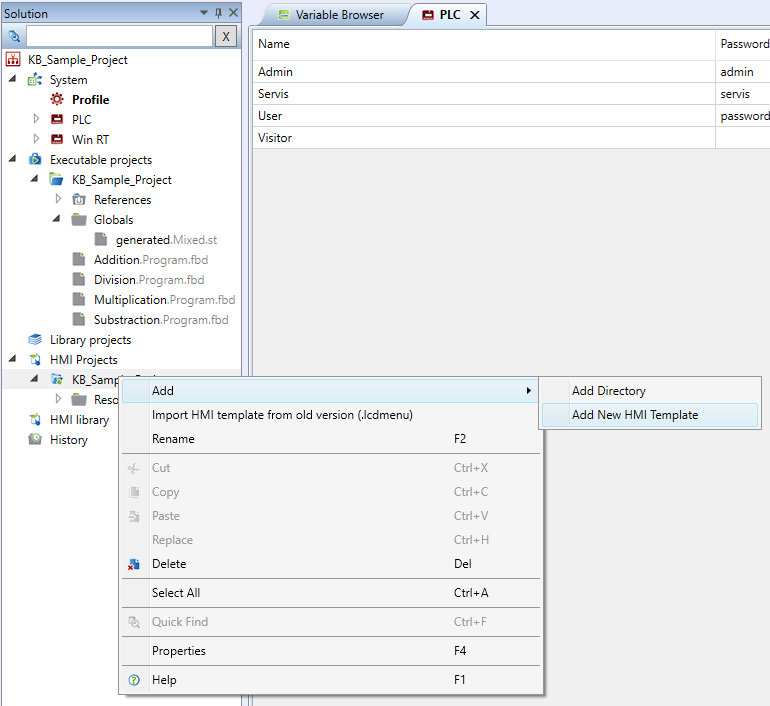
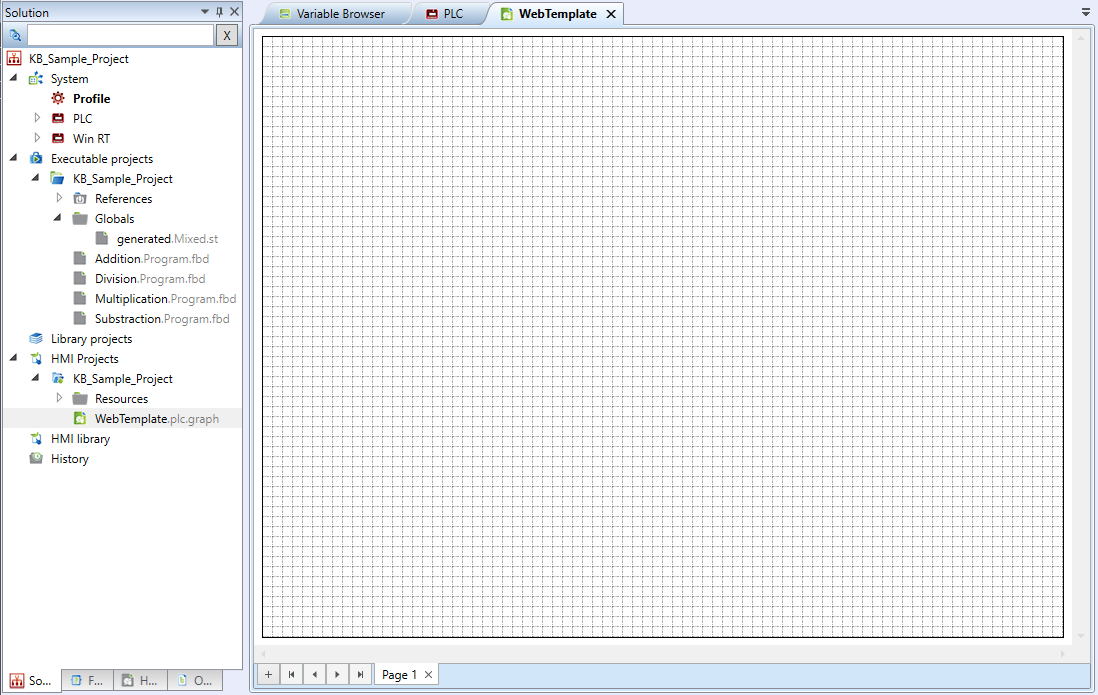
Web pages are designed in the integrated HMI editor as a template. Create a new HMI template:
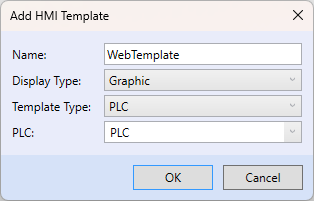
Then enter the name and type of the new template. Display type shall be “Graphic”. Template type shall be “PLC”, and the PLC shall be the name of the PLC for which the template is designed. This PLC will provide the variables to attach to the graphical objects.
Graphic template properties
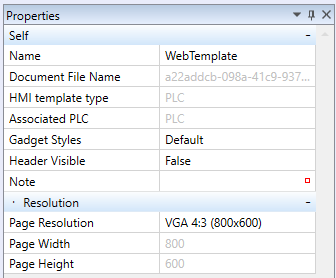
Each graphic template has specific properties: HMI template type, Attached PLCs, Gadget styles, optional Header, and Page resolution.
Editable properties are Template name, and Resolution. The resolution can be selected from the drop-down box to fit standard screen sizes, or entered as custom value.
How to create a template
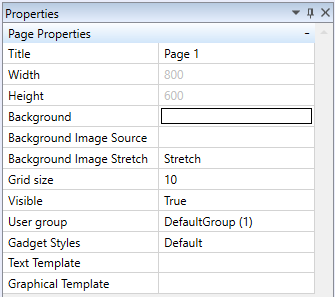
In Page properties:
Page properties
- Title - Page name, as will appear in the list of pages
- Width / Height - Resolution of the graphic template, should fit the expected browser resolution, however, the page automatically fits in the available browser window
- Background - The IDE colour palette offers specific colours for IDE, the Mervis palette contains synchronized colours in Mervis style
- Background image source - Select a background image if required
- Background image stretch
- None (maintains original image size)
- Stretch (the image fits into the panel)
- UniformStretch (keeps aspect ratio when stretching)
- Grid size - Grid size in pixels, helps to align objects on the page
- Visible - Visibility in the Mervis Visual page menu (if not visible in menu, must be referenced by a button from another page to allow access)
- User group - Group of users specifying access rights for this page
- Gadget styles - Visual styles of gadgets
Insert object from the HMI menu tab into the page, and bind them to PLC variables.
Usage of graphic HMI objects
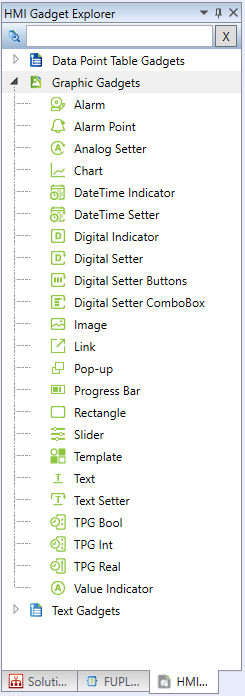
There are 19 object types with different properties. Objects can be dragged and dropped into the HMI template. Then, a PLC variable shall be assigned to the object.
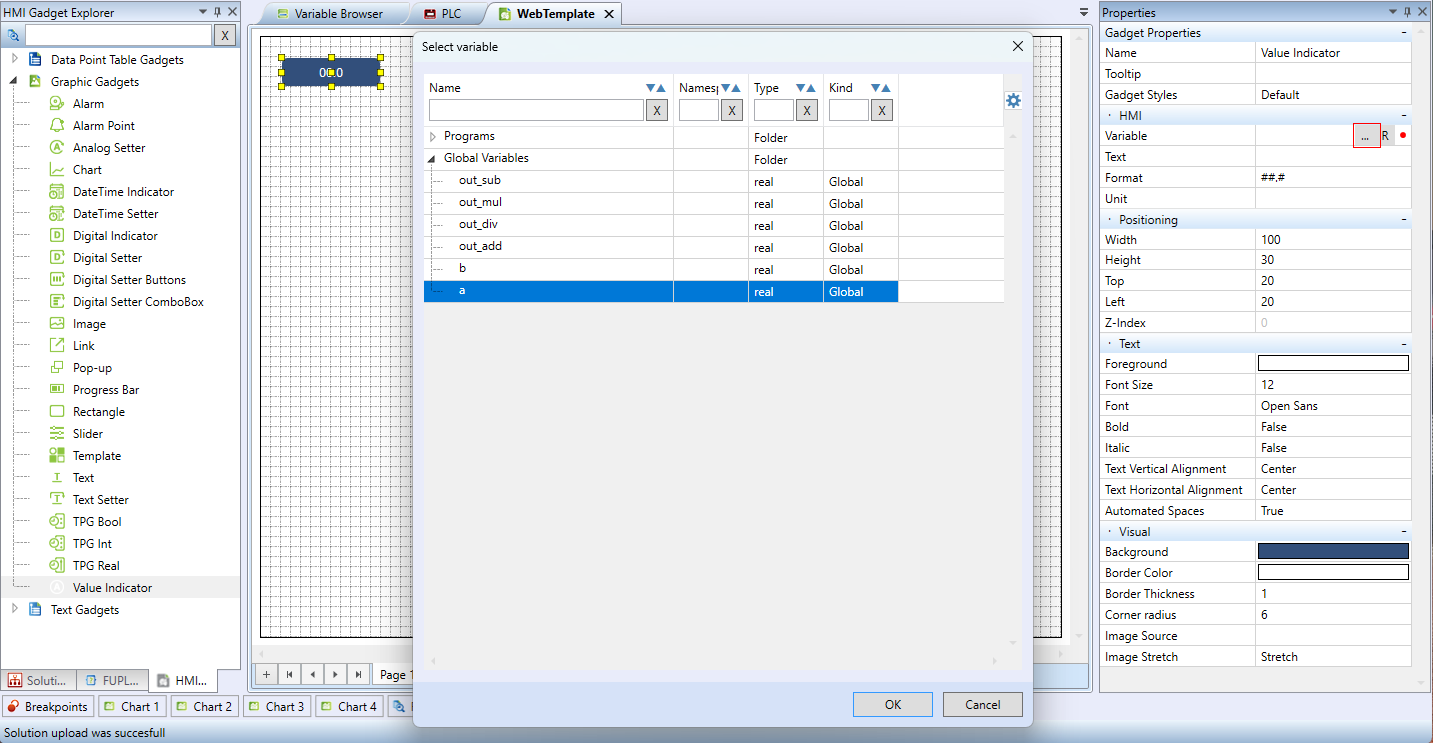
As an example, select a Value Indicator, and attach a variable from the PLC variable list.
Detailed description of HMI objects including their properties can be found here: Graphic HMI objects.
Add a page by clicking the “+” button. Delete a page by clicking the “x” next to the page name in the tab below.
Tips for faster engineering
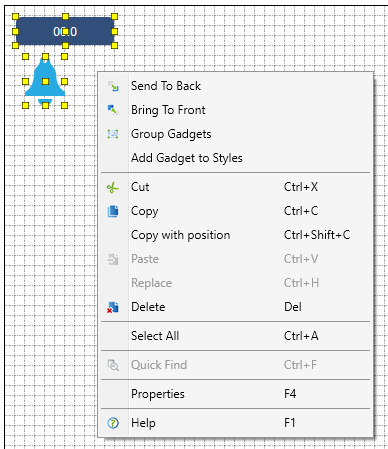
- Right click the objects in the HMI template workspace allows copying objects keeping their position (shortkeys Ctrl+Shift+C).
- Increasing/decreasing of the Z-index (bring to front / send to back) can also be done from the context menu (right click the object and “Bring to front” or “Send to back”) or in the upper bar (Z-index).
- Grouping objects allows create a group of objects for easy manipulation while maintaining distance between objects.
- Add Gadget to Styles - see Creating of Styles
User policy
Definition of user access rights with setup of user groups for individual pages is described on the User policy page.
Uploading web to PLC
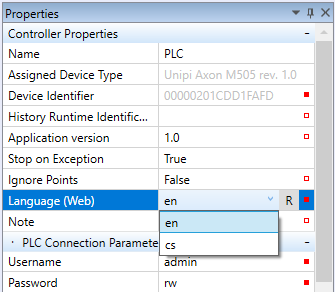
Before uploading web pages to PLC, select the web pages language. The selected language will be used for generic web texts, such as names of days of week, time schedules, menu etc.
Contact technical support if you need to add your language.
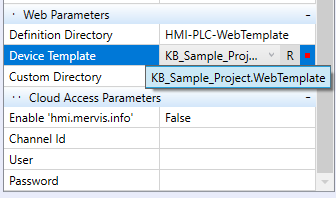
Next step is uploading the template to PLC: in PLC Properties, Web parameters, select the engineered template. The Definition directory is completed automatically. If the web template is not in your Solution, select the template definition in the Definition directory parameter.
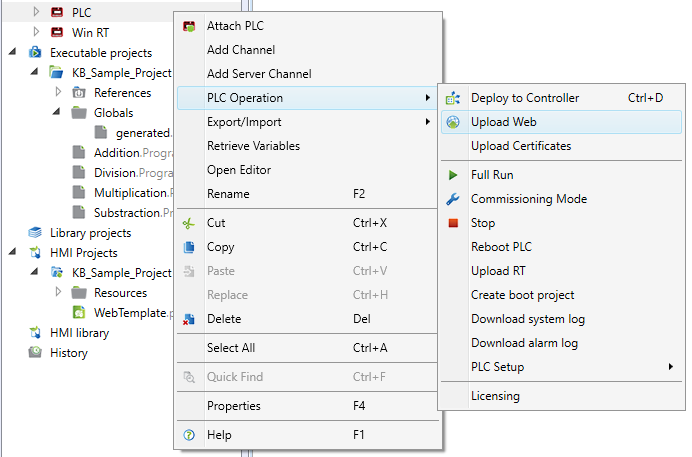
Then upload the web by clicking the “Deploy Solution” button or right click the PLC and select PLC Operation - Upload web.
Web operation
The operation of the web server shows activities of user with all access rights. Check the user access rights if some functions shown below are not available at your web.
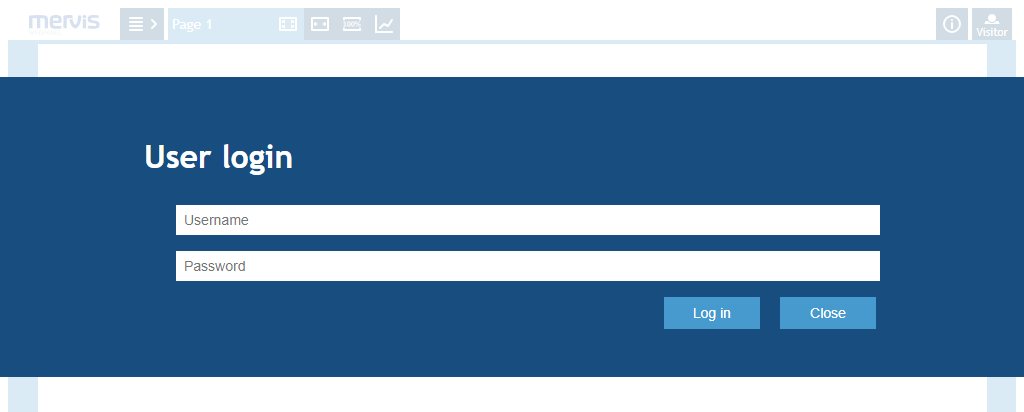
If the default web user has a password specified (not blank), after opening the PLC web page a login dialogue is displayed.
Logout
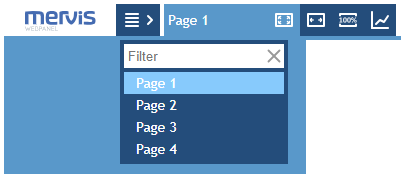
Browsing pages
Schema size
Trend data display
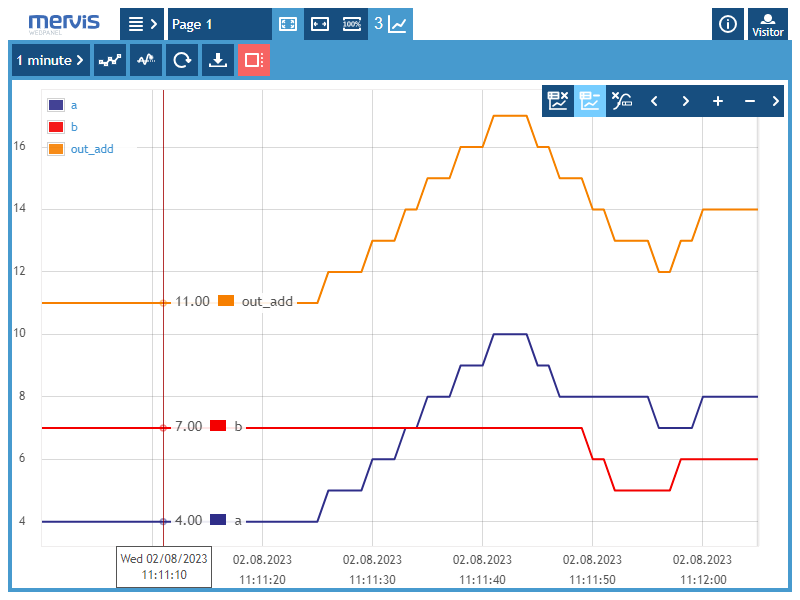
To display trend data in a graph, selct values to be displayed by Ctrl + left mouse click. The tagged values are listed at the graph icon. Values can be displayed as history (saved data only) or in oscilloscope mode (values are continuously updated with new samples).
Display in oscilloscope mode
Display history
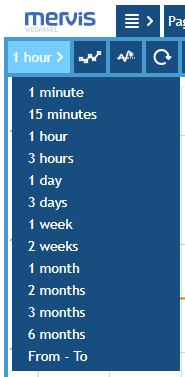
Configuration of saving trend data in a PLC is described in Configuration of saving data to database (history). To display trend data as a history, switch the Oscilloscope mode to off and select the time period to be displayed.
When the legend says “noData” check if the values are saved correctly into the PLC database.
Graph functions
Sampled values can be highlighted by clicking the Display All Points icon. 
Refresh the displayed data by the Refresh icon. 
Unselect the variables to display by clicking the Cancel selection icon 
Export the graph as PNG or CSV using the Save icon 
Alarm overview and alarm log
To display the overview of active alarms, make sure that the user has Alarm rights in "HMI User Rights" .
To show the alarms overview or alarm log at the web server, click the alarm display icon.
In the alarm list there are all alarms which are not in Normal state. Acknowledge alarms by clicking the “Confirm” button, and reset the inactive alarms by clicking the “Reset” button.
- Time - Time of the last refresh of the alarm overview
- Message - Datapoint name in the project
- State
- Active - Alarm active
- Active Ack. - Active acknowledged
- Memory - Inactive alarm
- Memory ack. - Inactive and acknowledged alarm (can be reset)
- Action
- Confim - Acknowledge an active alarm
- Reset - Delete an inactive and acknowledged alarm
Alarm log display
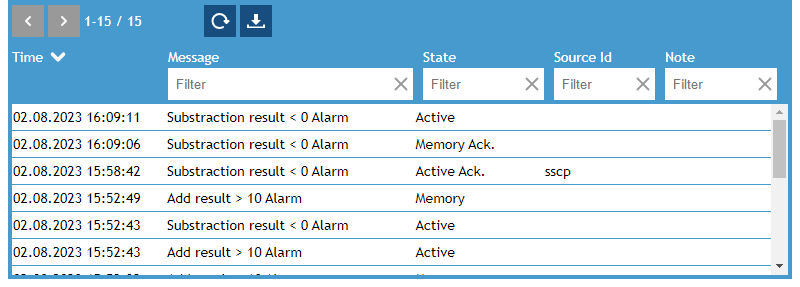
To display the alarm log on the web server, click the icon that shows / hides the alarm history panel.  (The alarm history is hidden by default.)
- Time - Time of appearance of the message
- Message - Datapoint name in the project
- State
- Active - Alarm active
- Active Ack. -Active acknowledged
- Memory - Inactive alarm, Memory ack. Inactive and acknowledged alarm (can be reset)
- Source - Client which changed the alarm state
Export the alarm log into a CSV file using the Export button  .
.
Alarm log functions
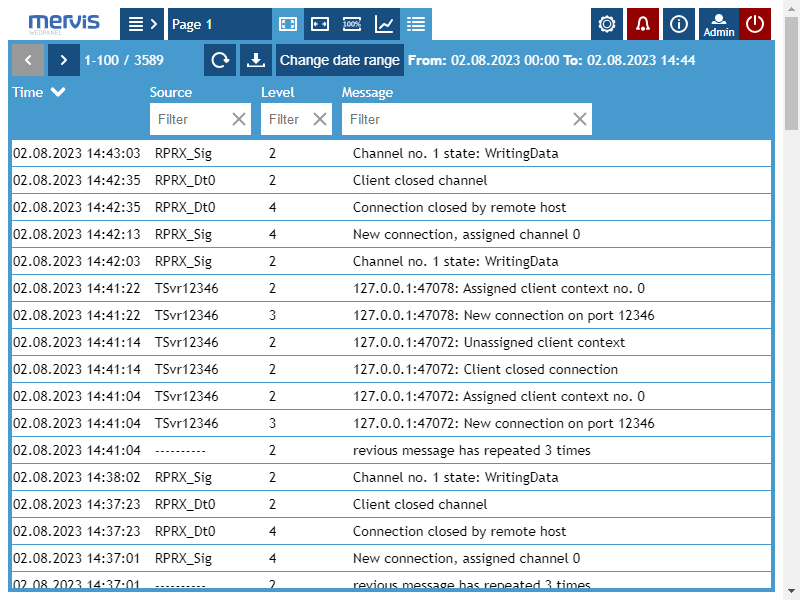
System log
To display the system log, user must have the System Log access right. See "User policy" setting.
Click the ![]() icon on the PLC web.
icon on the PLC web.
- Time - Time of appearance
- Source - Client or process that originated the message
- Level - System level, used for filtering
- Message - Message text
System configuration
See the system configuration setting at the "System configuration" page.
