Alarms
1 Tree Overview
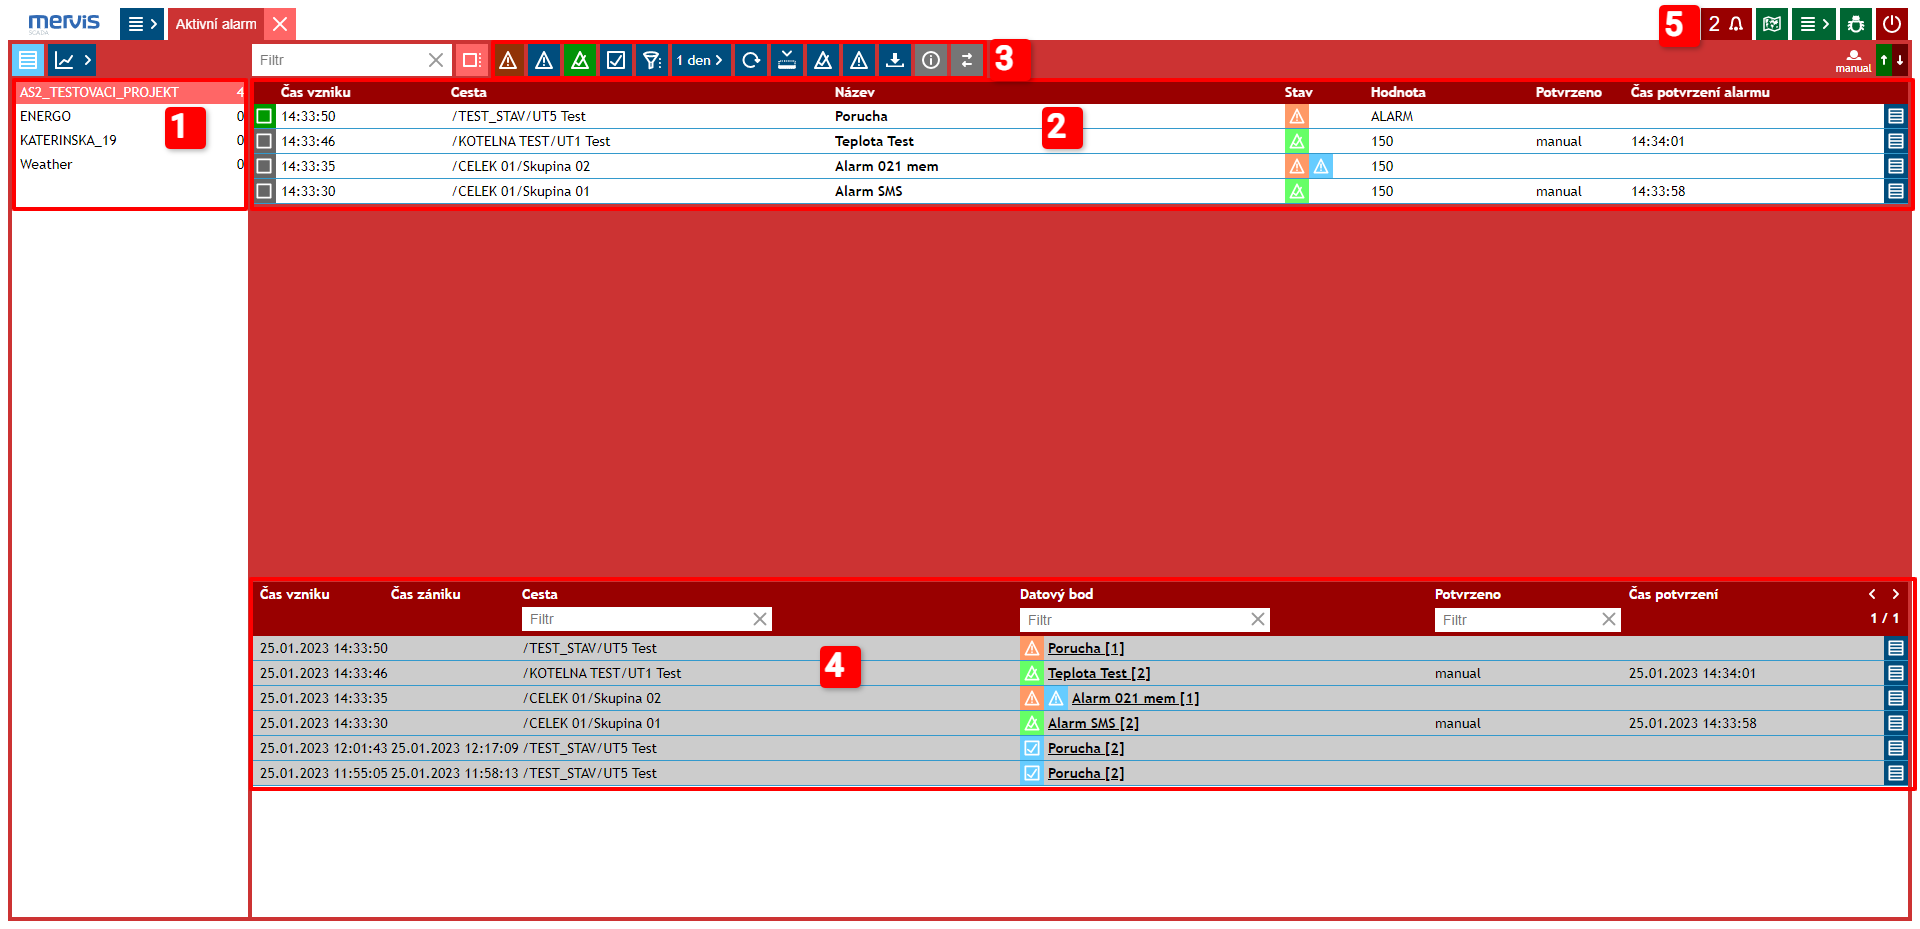
The display has two levels: Project name - data point located in the alarm.
Next to the project name is a digit indicating the total number of alarms within the project.
In the case of multiple projects, you can use the Filter or filter by significant properties.

2 Current Alarms
The overview shows all current data points in alarm.
For each data point, there is information about the alarm status:
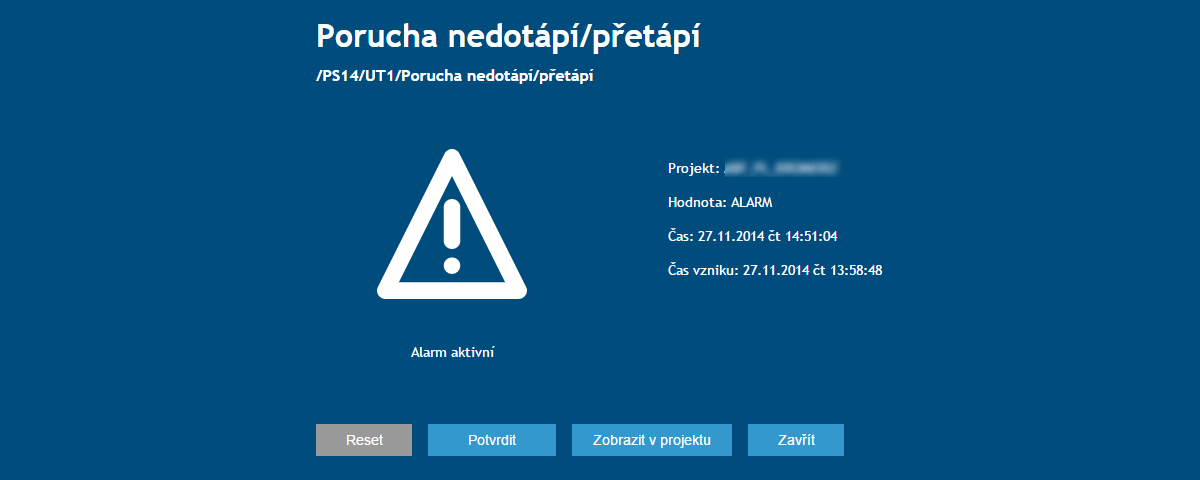
Clicking invokes a dialog box with information about the alarm value, the time the alarm occurred, and the current time. In the window, you can confirm the alarm, display it in the project, or just close the dialog box.
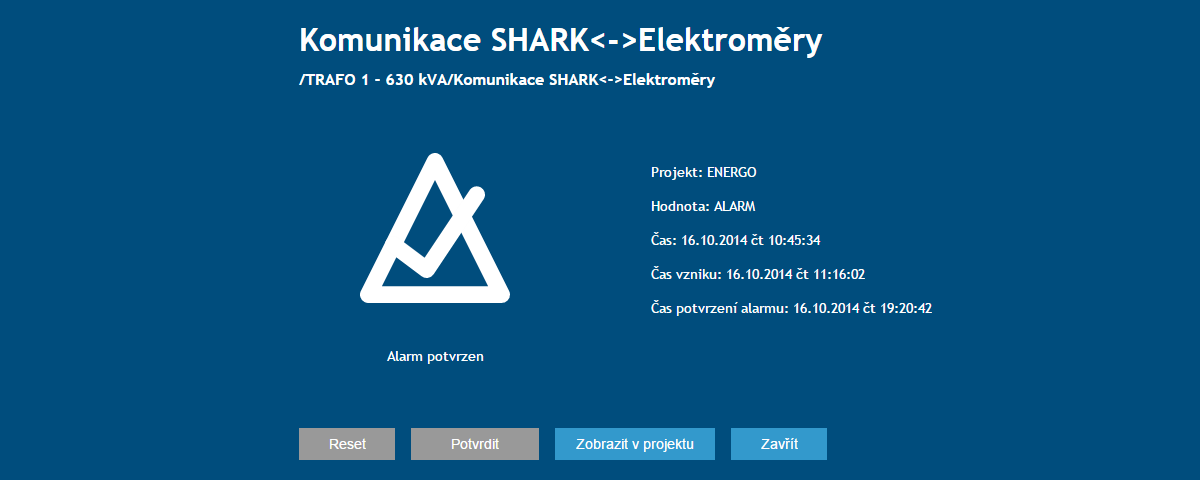
The dialog box no longer allows confirming the alarm. Additionally, it contains information about the time the alarm was confirmed.
3 Filtering Data Points in the Alarm Overview
4 Alarm History
History shows the time of alarm creation/cancellation, who (which user) acknowledged the alarm, and the current status of the alarm.
The history can be sorted by the time of alarm creation/cancellation.
Three Filters can be used for searching: path / data point / user
Alarm and Its States
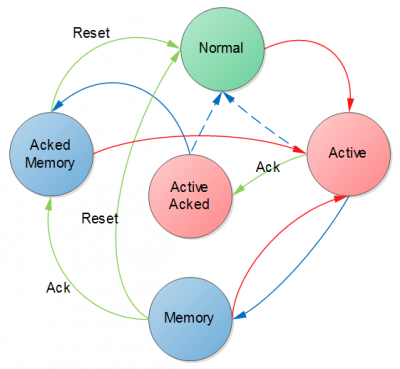
Each point that has active alarm behavior can, depending on the settings, take on different alarm states and gradually transition between these states, as shown in the following image.
- Texts in circles correspond to the alarm state
- Arrows between them represent the following transitions between states
- Red arrow - alarm creation
- Blue solid arrow - alarm cancellation
- Blue dashed arrow - alarm cancellation with enabled automatic reset
- Ack - acknowledgment request
- Reset - reset request
- If an action is triggered that is not plotted in the diagram, it is ignored (e.g., reset request in the Normal state)


