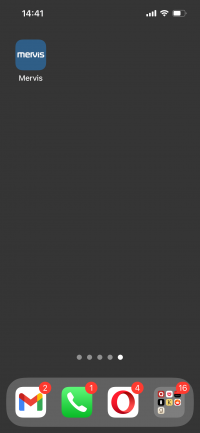
Installation on the iOS System
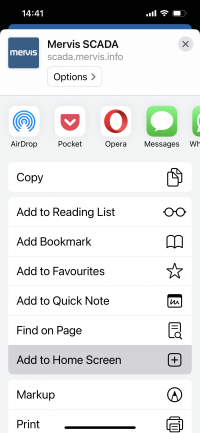
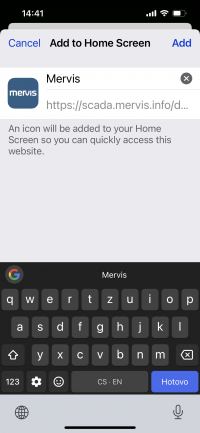
Application Installation
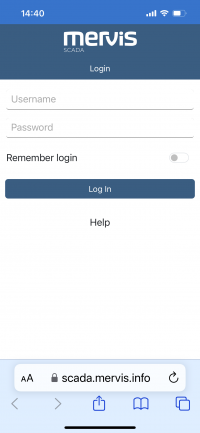
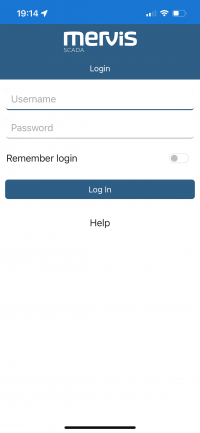
Login
After launching the application, you can enter your login credentials.
Projects - Project List
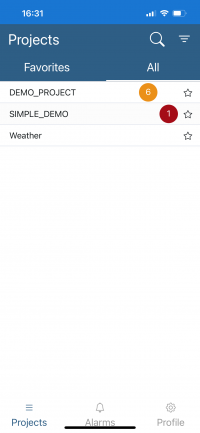
Upon logging in, your list of projects will be displayed.
Projects can be added to favorites by clicking on the star icon.
The number of data points with communication faults is indicated by a number in an orange circle

,
The number of data points with active alarms is displayed by a number in a red circle

.
Text View and Graphs
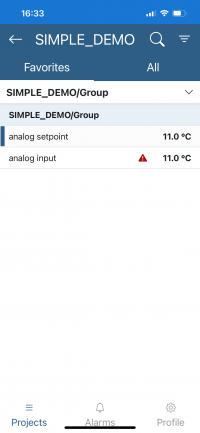
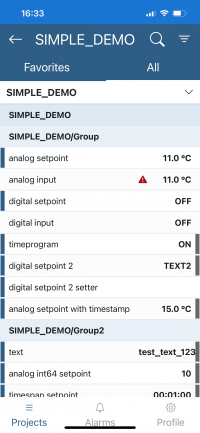
The selected project will be displayed in text view.
Data points with control capability are highlighted in blue on the left side.
The timestamp of the last update of the data point is indicated by the highlighting on the right side.
When held down, the selected data point is marked, and its history can be displayed in a line graph.
Alarms
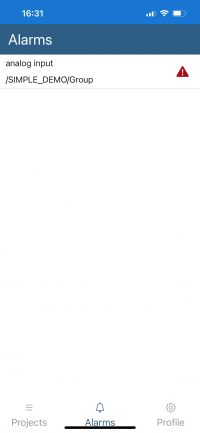
Under this tab, you can see an overview of alarms from all your projects.
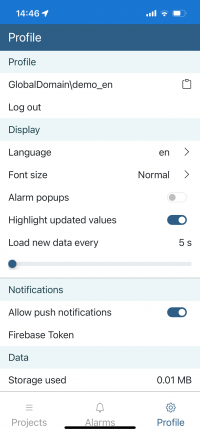
Profile - User Settings
Here, you will find the settings for your account and also the option to log out.
