Installation on the Android System
Application Download
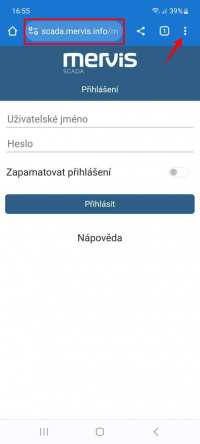
- Begin by entering the following address in your web browser (Google Chrome
 ): https://scada.mervis.info/mobile.
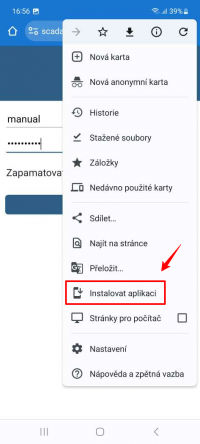
 - Click on the settings in the upper right corner to expand the browser options.
- Select “Install the application”.
- On your mobile device, you will find it under this icon
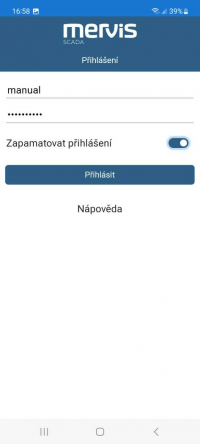
Login
Projects - Project List
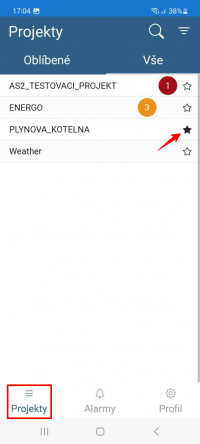
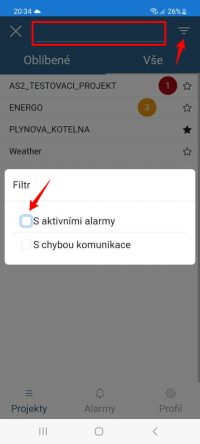
- After logging in, your list of projects will be displayed.
- Projects can be added to favorites by clicking on the star icon.
In the list, you can filter by project name, active alarms, and communication faults.
Text View and Graphs
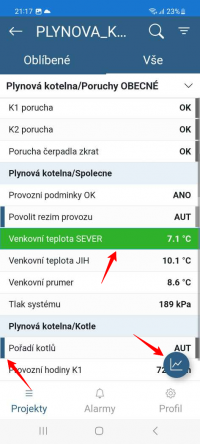
- The selected project will be displayed in text view.
- Data points with control capability are highlighted in blue on the left side.
- The timestamp of the last update of the data point is indicated by the highlighting on the right side.
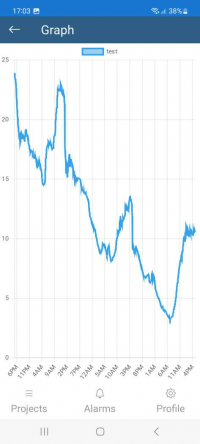
- When held down, the selected data point is marked, and its history can be displayed in a line graph.

