Table of Contents
FUPLA (Function Block Diagram) Language & Editor
FUPLA (Function Block Diagram - FBD) is a graphical programming language specifically designed for controller programming in the Mervis IDE. It is based on predefined blocks of code, where each block has a specific function, inputs, and outputs.
It is highly suitable for continuous processes, such as HVAC regulation and basic logic interlocking. Because the control logic is created simply by connecting blocks and variables, FBD is an excellent choice for users without deeper programming knowledge. In a single project, you can freely combine FUPLA with Structured Text (ST) depending on which language best suits each specific task.
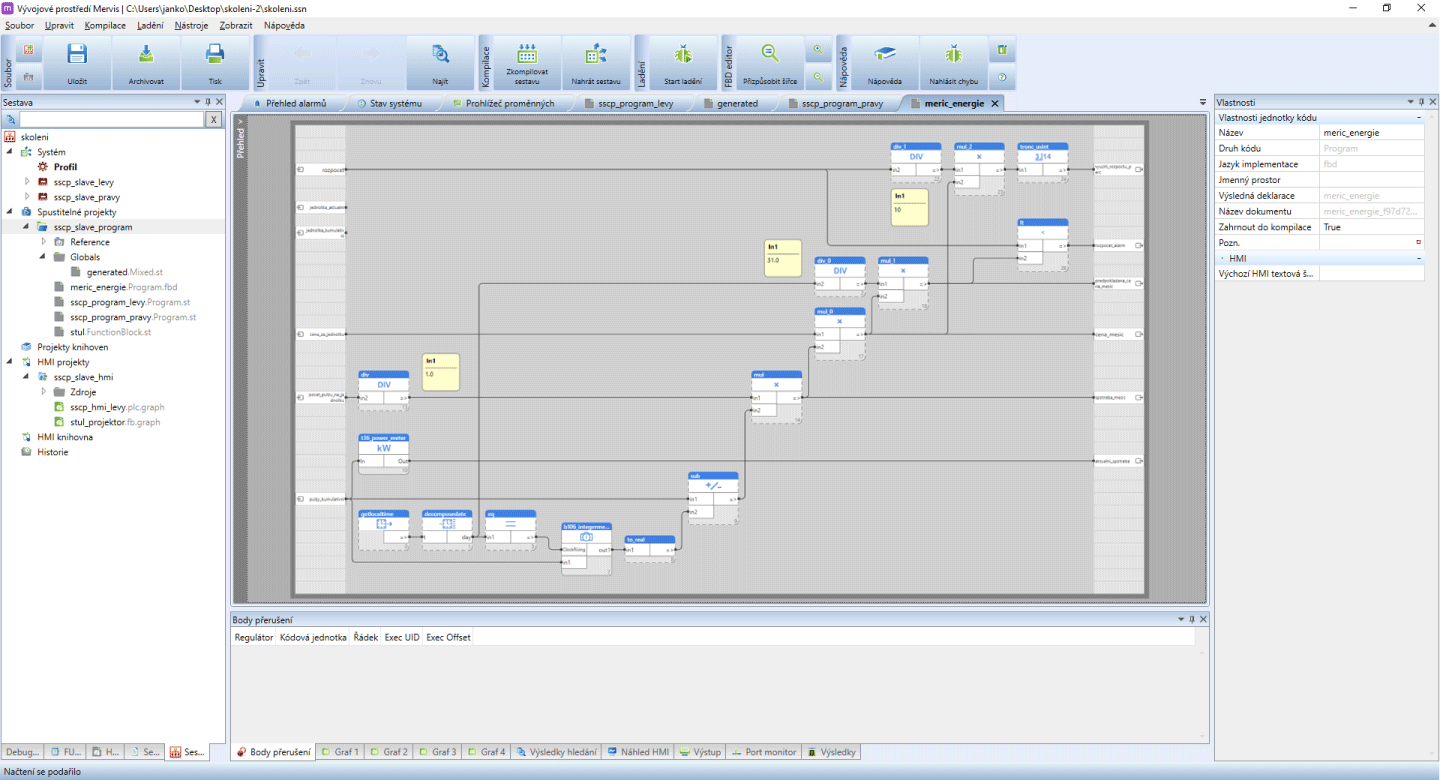
Editor Structure and Workspace
Double-click a newly created program in the Solution explorer to launch the FUPLA editor. The editor follows a logical “Signal Flow” structure from left to right:
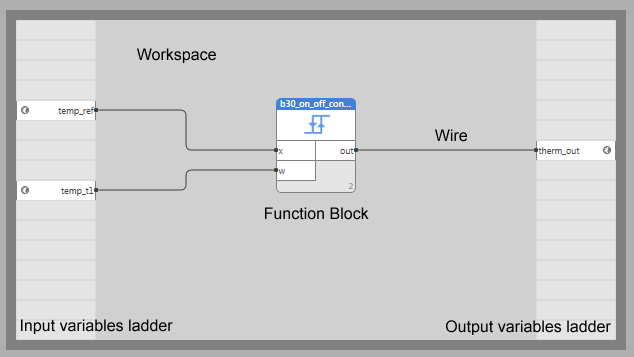
- The Left Ladder (Inputs): This is where you place global variables or physical inputs that the program reads from.
- The Work Area (Canvas): The central space where function blocks are placed and interconnected.
- The Right Ladder (Outputs): This area holds the variables to which you want to write results.
Resizing the Workspace & Ladders
You can increase or decrease the working area size using the grip points in the corners. You also have flexibility over the structural layout of your ladders:
- Manual Resizing: Look for the red circles located at the top corners of the active ladder. Simply left-click and drag these circles to expand or contract the width of the ladder manually.
- Menu Resizing: Alternatively, you can right-click the red circle to open the context menu. From here, you can select “Set Default Width” or choose “Match Other Ladder's Width”, which will instantly align the width for the selected ladder within the currently opened scheme.


Programming Workflow
To build an executable program, follow these standard proceedings:
1. Variable Placement
The work starts by placing the variables to read into the left ladder. Right-click a field in the ladder and select a command to insert an existing global variable or create a new one.

2. Adding Function Blocks
Right-click in the working area and select “Add library box”. Use the filter and/or arrow keys to locate the required function block, then click OK. Mervis IDE features a large library of default function blocks covering most basic PLC operations. If a required block is not in the list, most probably the library containing it is not referenced in the project.

3. Block Configuration & I/O Visibility
Click on any function block to display its properties in the property grid. In the Properties panel, the list of values is displayed, together with their values and visibility data. Here, the visibility of inputs, parameters, and outputs may be toggled, and fixed (default) values may be entered.

4. Wiring and Connections
Connecting blocks and input/output variables follows by dragging a connecting wire.
- Point the mouse to the output port of a variable or block; the cursor will change shape.
- Hold the left button and drag the wire to the input port of the target block or output ladder.
- If the link is correct, the wire goes green. Release the left button to insert the wire.
- Note: Beware of wires which connect the input and output of the same block; remember to route them from under the block right after the wire has been inserted.

Editing Wires & Junction Points
The connecting wires can be edited by clicking an existing wire to view the editing points. You can change the shape by dragging its internal points, or move the endpoints to connect to a different input/output.
To organize a complex schematic, you can use knee points and junction points:
- Create a Knee Point: Right-click an active wire and select “Create point” to insert a manipulatable corner into the wire.
- Working with Junction Points: Junction points act as a visual aid to prevent messy, overlapping wires. Instead of routing multiple wires across a schematic, route one wire to a central location, right-click the segment, and select “Insert Junction Point”. You can then branch off multiple connections from that single point. To remove it, select the point and press Delete.


Color-Coded Wires & Debug Indicators
To help rapidly identify data types on the canvas, wire colors are hardcoded and automatically adjust for contrast in Light/Dark themes:
| Data Type | Wire Color |
|---|---|
| Booleans | Blue |
| Analogs (Real/Float) | Green |
| Pointers | Brown |
| Others | Black (or White Smoke in Dark Theme) |
Additionally, when you are in Debug mode, the editor provides an immediate visual indication of boolean states:
- A thick blue wire represents a True value.
- A thin blue wire represents a False value.

5. Compiling and Deployment
Once your logic is wired, click the “Build solution” button to compile the program. Check for errors in the result window, and after fixing them, deploy the program to the controller.